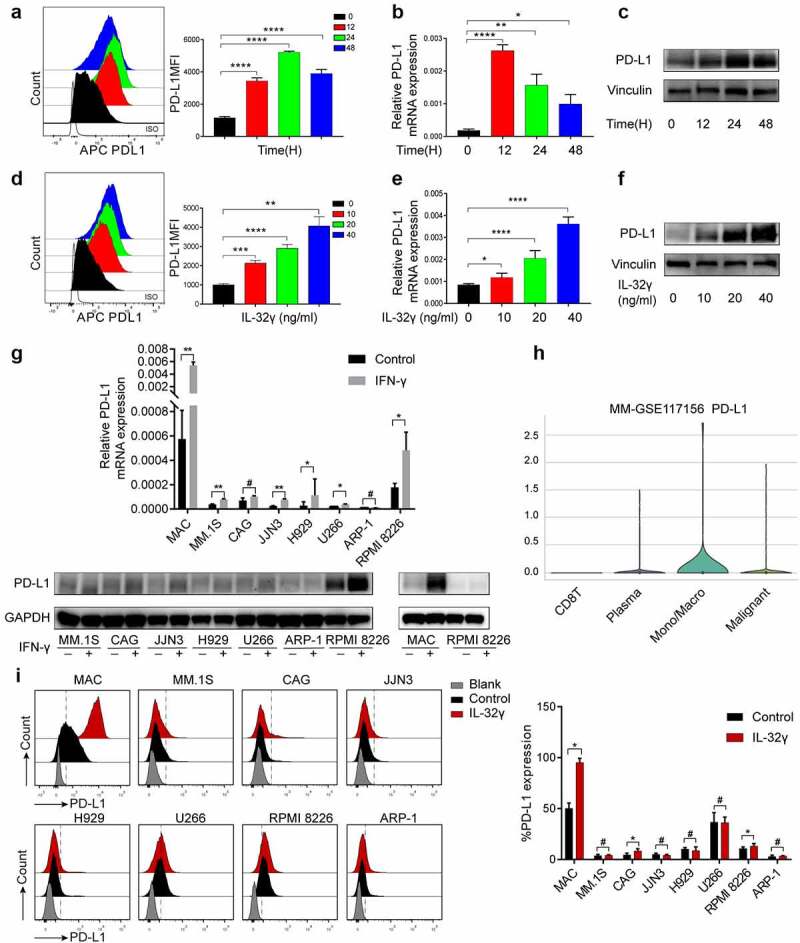
Figure 2.

IL-32γ promotes PD-L1 expression in macrophages. (a) Flow cytometry analysis of PD-L1 level in macrophages treated with IL-32γ (40 ng/ml) at different time points. (b) qRT-PCR analysis of PD-L1 mRNA level in macrophages treated with IL-32γ (40 ng/ml) at different time points. (c) Western blot analysis of PD-L1 level in macrophages treated with IL-32γ (40 ng/ml) at different time points. (d) Flow cytometry analysis of PD-L1 level in macrophages treated with IL-32γ (24 h) for the indicated concentrations. (e) qRT-PCR analysis of PD-L1 mRNA level in macrophages treated with IL-32γ (24 h) for the indicated concentrations. (f) Western blot analysis of PD-L1 level in macrophages treated with IL-32γ (24 h) for the indicated concentrations. (g) PD-L1 expression in 7 MM cell lines and macrophages treated with IFN-γ (20 ng/ml) was measured by qRT-PCR and western blotting, respectively. (h) Distribution of the PD-L1 expression in different cell types in MM (Violin plot) by using the TISCH database. (i) Histograms representing cell surface expression of PD-L1 on macrophages (MAC), MM.1S, CAG, JJN3, H929, U266, RPMI 8226, and ARP-1 after vehicle or IL-32γ (20 ng/ml) treatment for 24 h. Data are presented as the mean ± SD of at least three independent experiments; *p < .05, **p < .01, ***p < .001.
