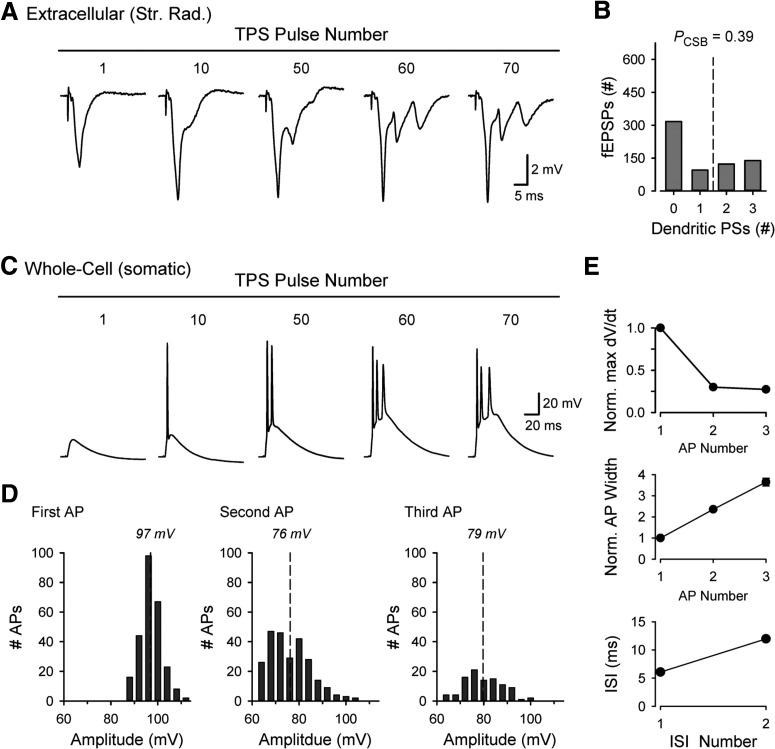
Figure 1.
Theta-frequency stimulation-induced CS bursting. A, Extracellular recording (in stratum radiatum) showing EPSP-evoked bursting during TPS. Note the negative-going PSs elicited by EPSPs during the train. B, Histogram represents the number of EPSPs evoking 0-3 dendritic PSs and probably of EPSP-evoked CS bursts (PCSB) during a 15 s train of TPS (n = 9 slices). C, Somatic, whole-cell current-clamp recording showing EPSP-evoked CS bursting during TPS. D, Histograms represent peak amplitudes for the first, second, and third APs in EPSP-evoked CS bursts (n = 6 cells). Dashed lines indicate mean AP amplitude. E, Properties of CS burst APs. Plots represent maximum dV/dt during rising phase of each AP (top) and AP width at half-max (middle, both normalized to first AP). Bottom, Interspike intervals (ISI).

