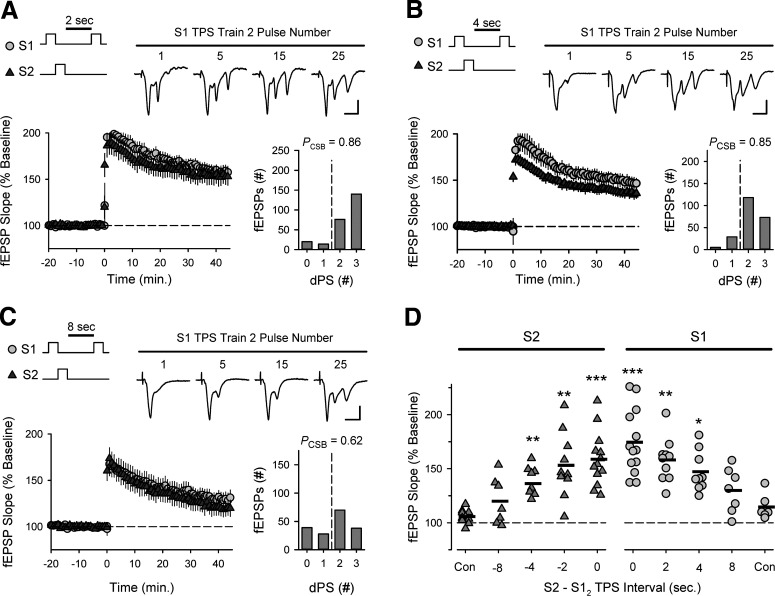
Figure 12.
Time course of retroactive non-Hebbian cooperativity in CS burst-dependent LTP. A-C, Following S1 → S2 trains of TPS (each 5 s in duration), a third train of TPS was delivered to S1 synapses with a delay of 2 (A, n = 10), 4 (B, n = 9), or 8 s (C, n = 7). Histograms represent the number of fEPSPs eliciting 0-3 dendritic PSs during the final TPS train delivered to S1 synapses from all experiments. Traces represent fEPSPs elicited at the indicated stimulation pulse numbers during the final S1 TPS train. Calibration: 2 mV, 10 ms. D, Summary plot showing the effect of the ITI between second and third trains of TPS on LTP induction. Symbols represent change in fEPSP slopes (45 min after last TPS train) from individual experiments. Bars indicate mean values. S1 controls (con) are from experiments shown in Figure 11A. S2 controls are from experiments shown in Figure 11B. Points for ITIs = 0 are from experiments shown in Figure 11C. ***p < 0.001; **p < 0.01; *p < 0.05; compared with S1 or S2 controls, one-way ANOVA with Bonferroni t test post hoc comparisons (S1: F(4,40) = 9.095, p < 0.001; S2: F(4,44) = 10.974, p < 0.001).

