Figure 13.
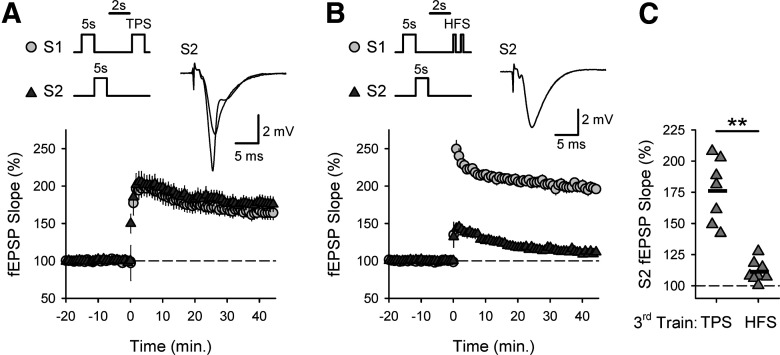
High-frequency trains of single spikes fail to update TPS-induced eligibility traces. A, Following two sequential, 5-s-long trains of TPS delivered to S1 and S2 synapses, a third train of TPS delivered to S1 synapses (duration = 5 s, ITI = 2 s) induces LTP at both S1 and S2 synapses (n = 7). B, HFS of S1 synapses delivered 2 s after sequential trains of TPS-5s delivered to S1 and S2 synapses fails to induce LTP at S2 synapses (n = 8). Traces represent superimposed S2 fEPSPs recorded during baseline and 45 min after the final train of TPS or HFS delivered to S1 synapses. C, Summary plot showing change in S2 fEPSP slopes when the third train in the stimulation protocol was either TPS or HFS delivered to S1 synapses. Symbols are results from individual experiments. Bars indicate mean values. At 45 min after the final S1 stimulation train, S2 synapses were potentiated to 176 ± 10% of baseline when TPS was delivered to S1 synapses and were 111 ± 3% of baseline when HFS was delivered to S1 synapses (t(13) = 6.727, **p = 1.41 × 10⁻⁵).

