Figure 6.
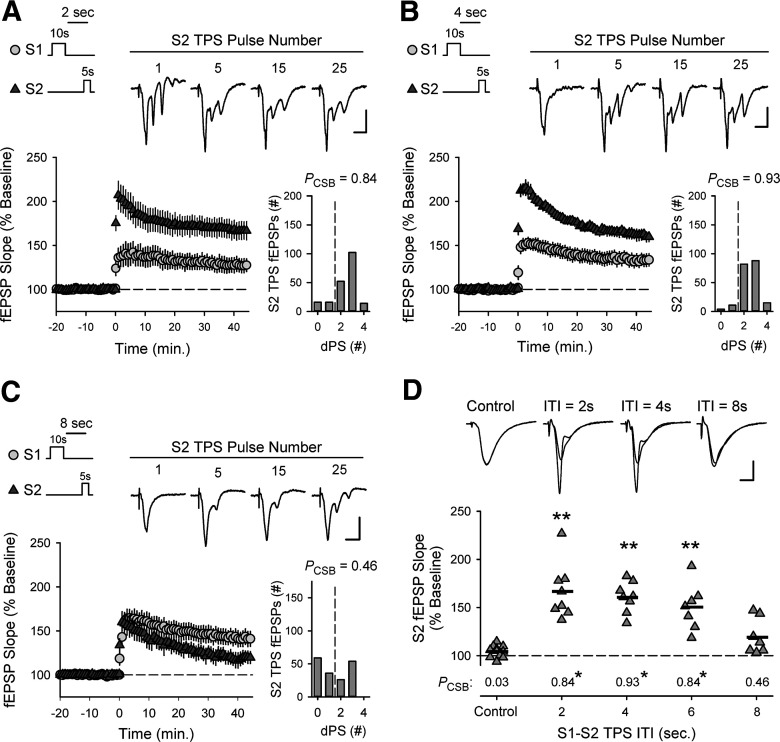
CS burst-dependent LTP exhibits behavioral timescale cooperativity. A-C, TPS (5 s) was delivered to S2 synapses 2 (A, n = 8), 4 (B, n = 8), or 8 s (C, n = 7) after a 10-s-long train of TPS delivered to S1 synapses. Traces represent S2 fEPSPs evoked by the indicated pulse number during TPS. Calibration bars: 2.0 mV, 10.0 ms. Histograms represent number of fEPSPs that elicited 0-4 dendritic PSs during S2 TPS from all experiments. D, Summary plot showing results from all experiments. Symbols represent change in S2 fEPSP slopes (45 min after TPS) from individual experiments. Bars indicate mean values. **p < 0.001, compared with interleaved control experiments (5 s of TPS delivered to S2 alone, n = 11), one-way ANOVA with Bonferroni t test post hoc comparisons (F(5,42) = 21.163, p < 0.001). Numbers indicate PCSB during S2 TPS. *p < 0.05, compared with control, one-way ANOVA on ranks with Dunn's test post hoc comparisons (H(4) = 26.777, p < 0.001). The magnitude of LTP induced at S2 synapses was significantly correlated with the PCSB during S2 TPS (Pearson product moment correlation: r = 0.758, p = 9.27 × 10⁻⁹, n = 41). Traces represent superimposed S2 fEPSPs recorded during baseline and 45 min after S2 TPS from a control experiment (S2 TPS alone) and in experiments with different S1 → S2 TPS ITIs. Calibration: 2.0 mV, 5 ms.

