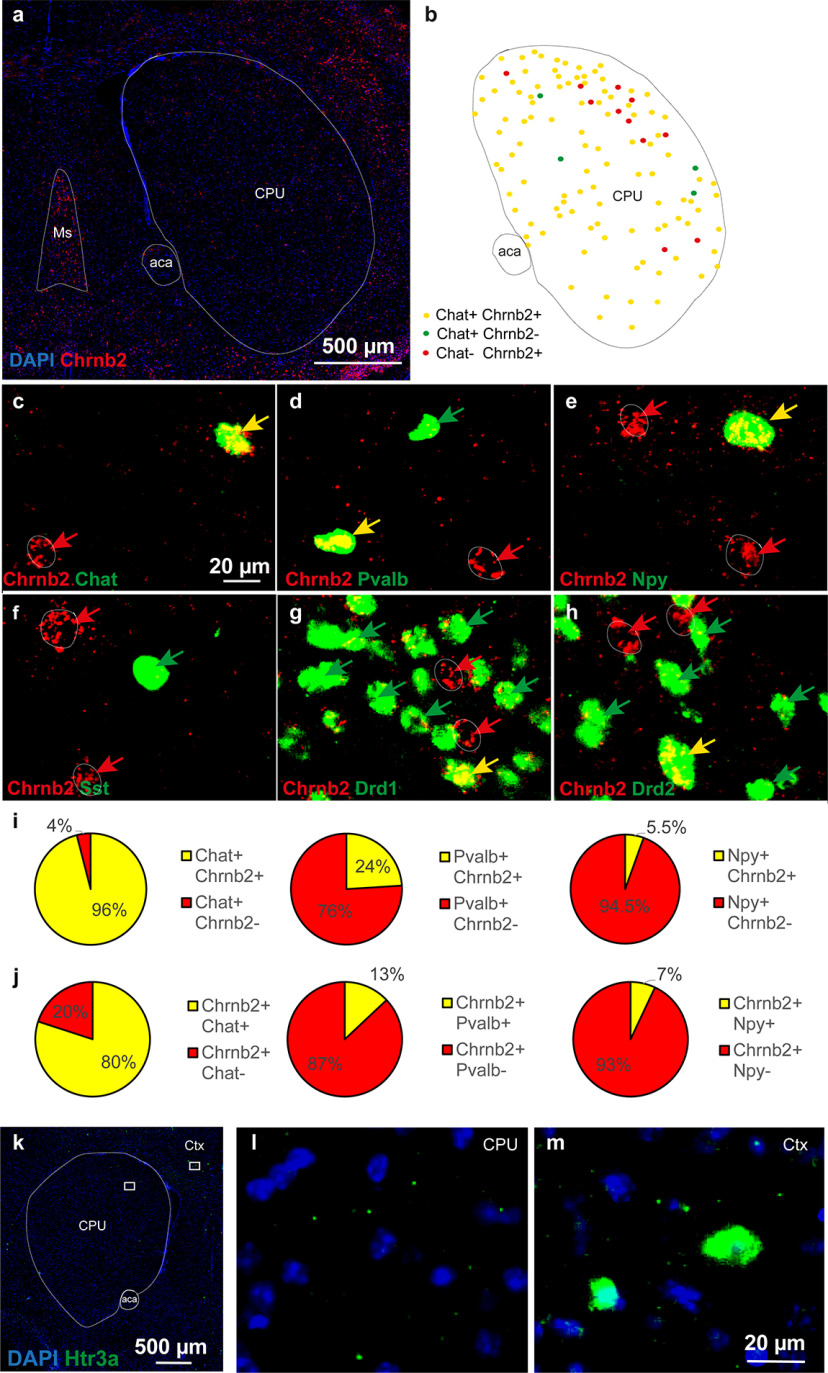
Figure 3.
Double-labeling riboprobe FISH of serial sections identifying neuronal phenotypes expressing Chrnb2 gene in mouse striatum. a, Overview of Chrnb2 expression in the CPU at bregma 0.5. Red represents Chrnb2. Blue represents DAPI. b, Schematic summary of findings mapping the extent of Chrnb2 and Chat overlap within CPU subnuclei. c–h, Closeups of codetection of Chrnb2 (red) with the following (in green): (c) Chat, (d) Pvalb, (e) Npy, (f) Sst, (g) Drd1, and (h) Drd2. Arrows point to cells positive for one mRNA only (red or green) or double-positive (yellow arrows). i, Quantitative analysis of the proportion of Chat, Pvalb, or Npy gene-expressing neurons in the mouse striatum, displaying Chrnb2 mRNA. j, Quantitative analysis of the proportion of Chrnb2 gene-expressing neurons in mouse striatum displaying also Chat, Pvalb, or Npy mRNA. i, j, Percentage indicates the result of quantification per CPU from 3 male mice. A mean of 700, 1200, 520, and 830 for Chat, Npy, Pvalb, and Sst neurons, respectively, was analyzed per brain. k-m, Htr3a+ cells in mouse coronal brain section. l, Only minimum to none of Htr3a+ cells were found in the CPU. m, Several cells strongly positive for Htr3a are shown in the cortex. Ms, Medial septum; aca, anterior commissure; Ctx, cortex.

