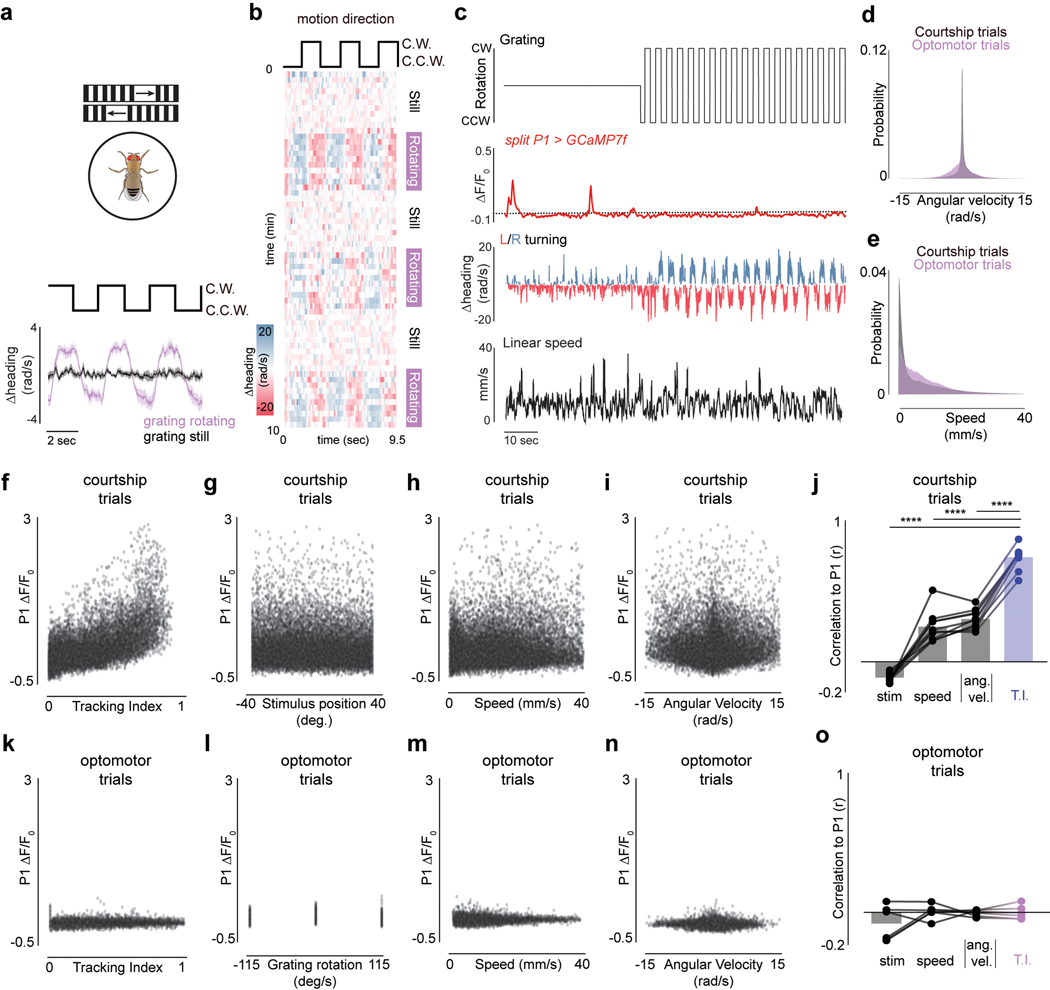
Extended Data Figure 6 |. P1 neurons are uncorrelated from the motor implementation of courtship.
a, Schematic of preparation for evoking optomotor responses using wide-field motion (top), and the turning responses of animals presented with alternating-direction wide-field motion. b, Example of a male’s turning during an optomotor trial. Each row consists of three stimulus cycles. Purple bars indicate when the grating is rotating. c, Example of the functional response (ΔF/F0) of P1 neurons during an optomotor trial, before and during the grating oscillates, as well as the angular velocity and linear speed of the animal. d, Histogram of angular velocities observed during courtship trials (gray) and during optomotor trials (purple). e, Histogram of linear speeds observed during courtship trials (gray) and during optomotor trials (purple). f-i, Scatter plots of P1 activity versus the tracking index (f), the stimulus position (g), the linear speed (h) and the angular velocity (i) of all animals during courtship trials. j, Correlation between P1 activity and the parameters explored in k-n during courtship trials. Individual data points are animals. k-n, Scatter plots of P1 activity versus the optomotor tracking index (k), the velocity of the grating (l), the linear speed (m) and the angular velocity (n) of all animals during optomotor trials. o, Correlation between P1 activity and the parameters explored in p-s during optomotor trials. Individual data points are animals. All shaded line plots are mean±s.e.m.; *indicates p < 0.05, **indicates p < 0.01, *** indicates p < 0.001, and **** indicates p < 0.0001. Details of statistical analyses and group sizes are given in Supplementary Table 1.

