Figure 1.

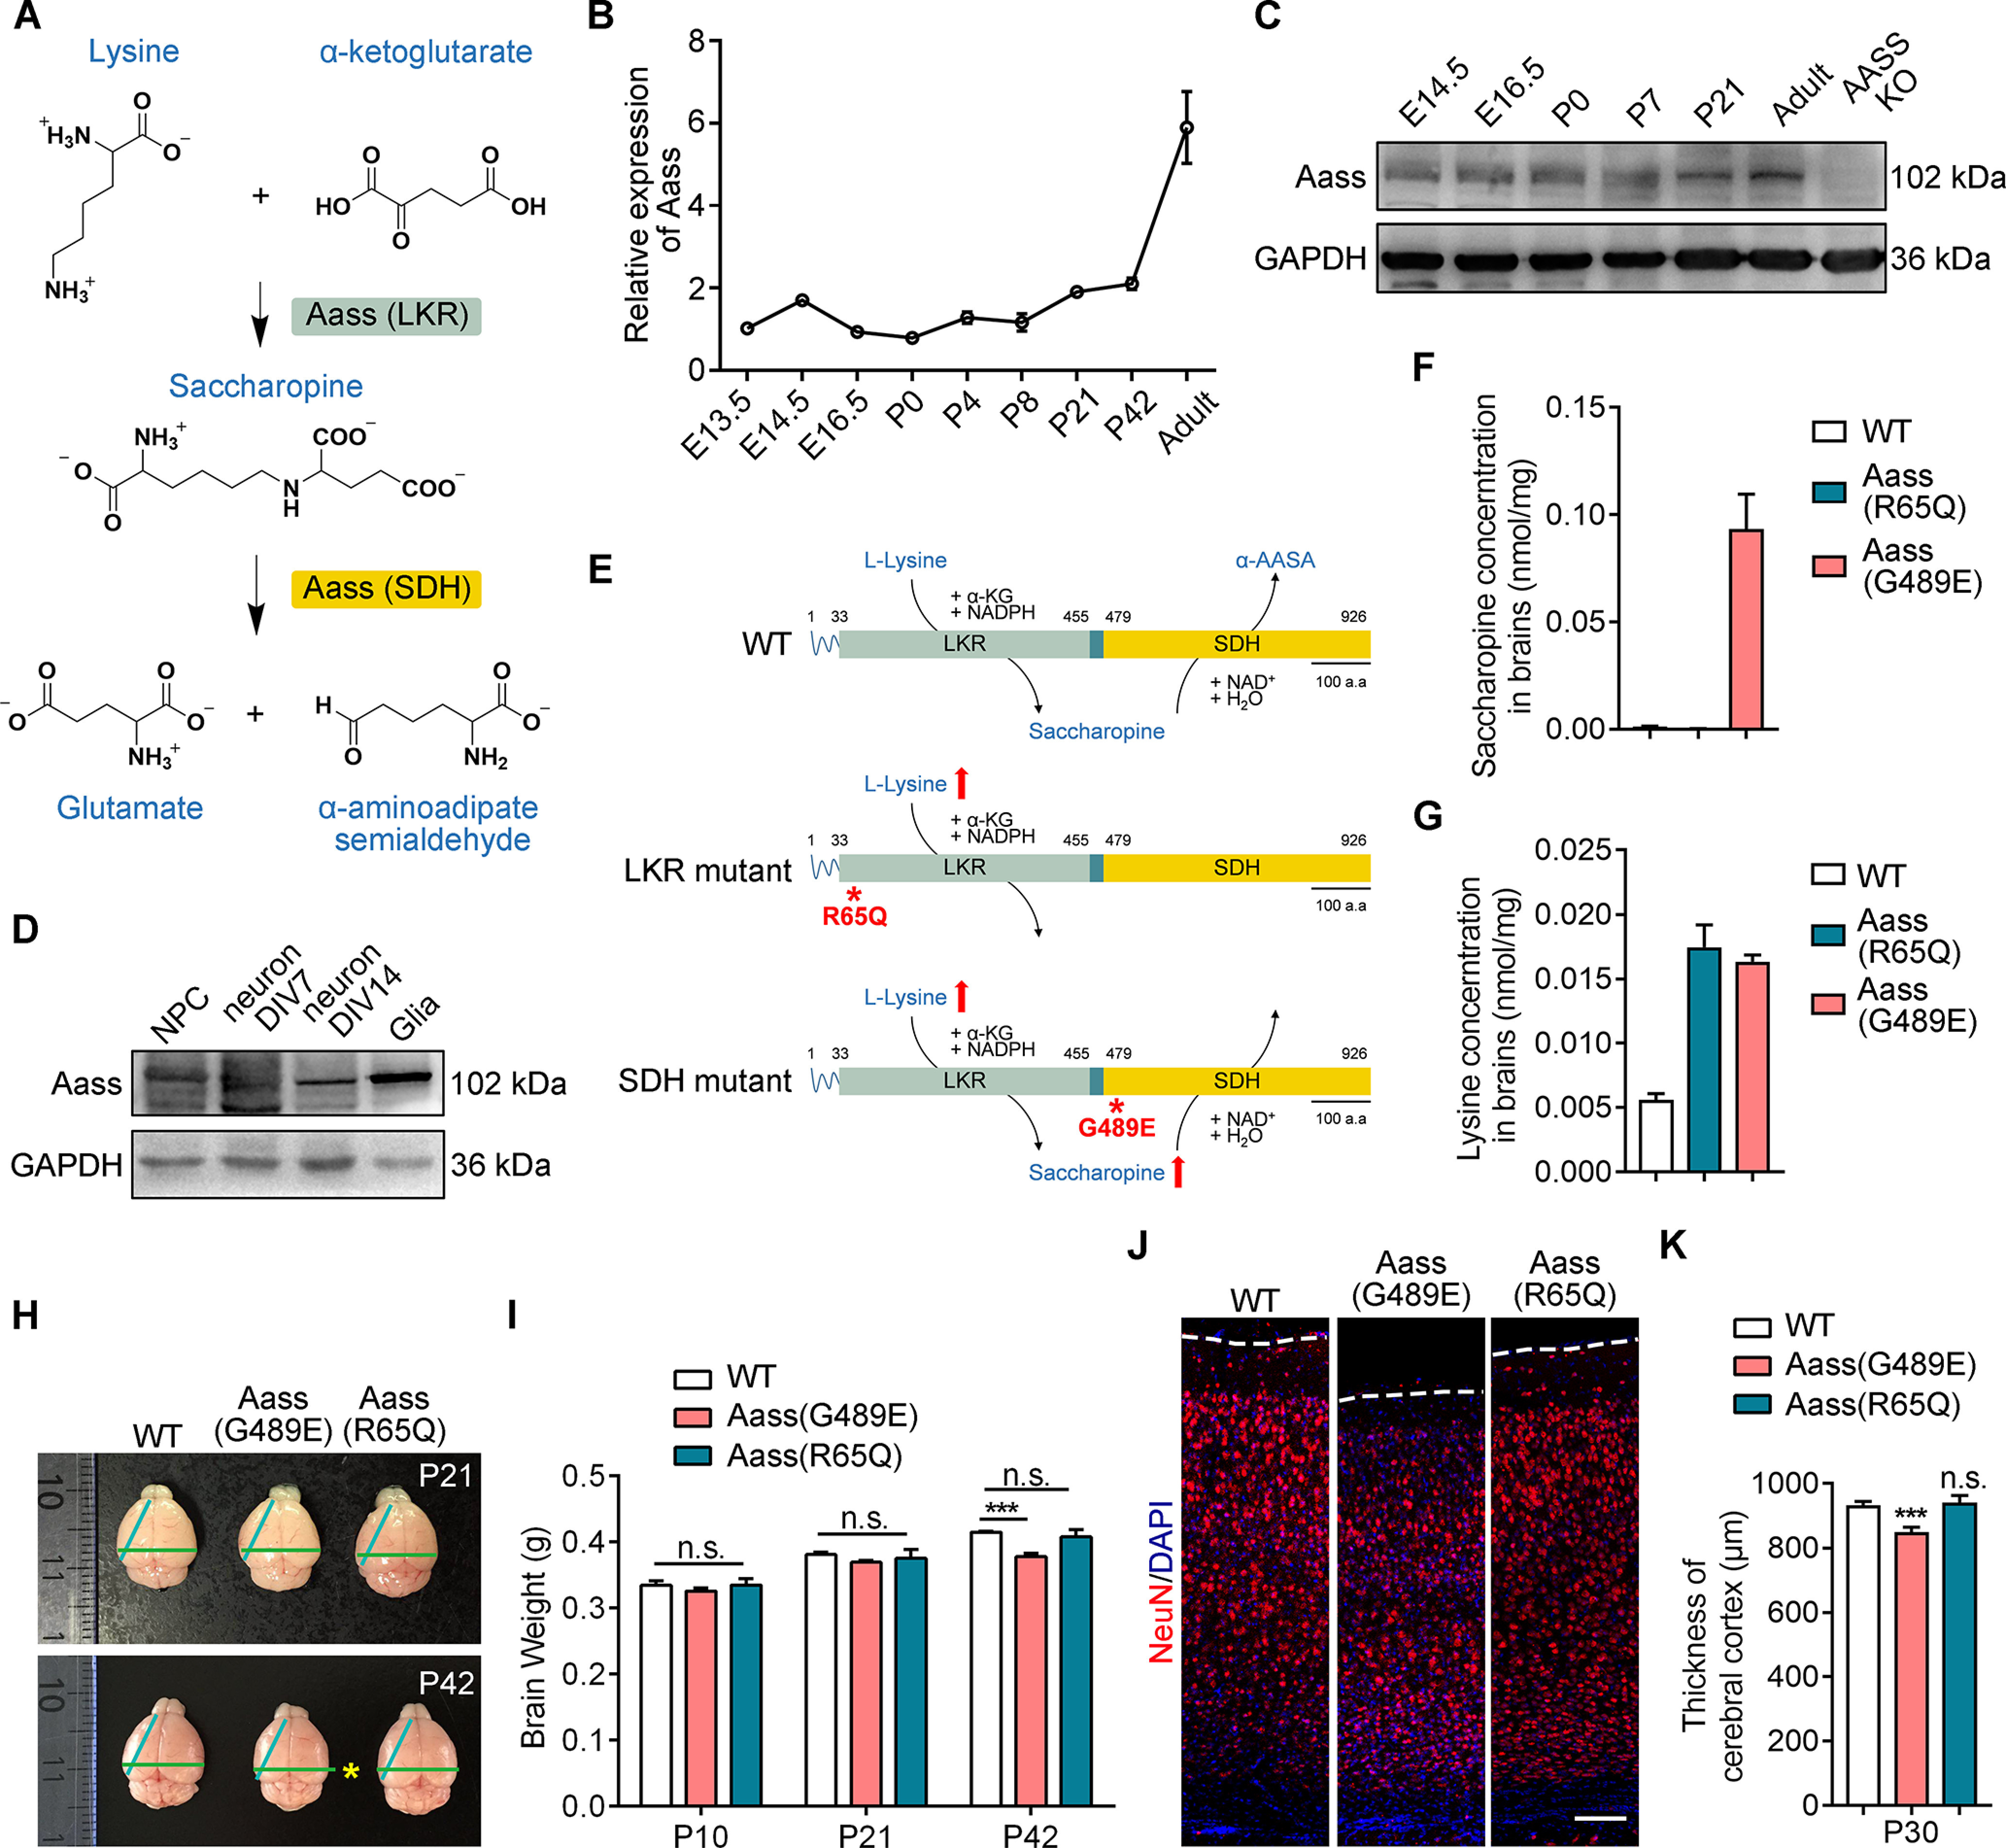
SDH mutation, but not LKR mutation, leads to reduced brain size. A, Graphic description of mitochondrial lysine degradation. B, Real-time PCR analysis showing the relative expression of Aass in cerebral cortex at different developmental stages from E13.5 to adult. Aass mRNA levels were normalized to Gapdh. The values of E13.5 were set to 1. C, Western blotting showing the expression of AASS in cerebral cortex at different developmental stages from E14.5 to adult. D, Western blotting showing the expression of Aass in the cultured NPCs, neurons (DIV7 and DIV14), and glial cells. E, Schematic illustration of full-length Aass, R65Q, and G489E mutations. F, G, Saccharopine (F) and lysine (G) levels in the brains of WT, Aass (R65Q), and Aass (G489E) mice. n = 3 brains. H, Representative images of brains dissected from WT, Aass (G489E), and Aass (R65Q) mice at P21 and P42. I, Quantification of brain weight of WT, Aass (G489E), and Aass (R65Q) mice at P10, P21, and P42. One-way ANOVA, F(2,15) = 2.675, WT versus Aass (G489E), ***p < 0.0001; WT versus Aass (R65Q), p = 0.8061. WT, n = 6 brains; Aass (G489E), n = 7 brains; Aass (R65Q), n = 5 brains. J, Coronal sections of WT, Aass (G489E), and Aass (R65Q) brains stained with Neuronal nuclear antigen (NeuN) (red) at P30. Nuclei were stained with DAPI (blue). Scale bars: 100 μm. K, Quantitative analysis of the thickness of cerebral cortex from WT, Aass (G489E), and Aass (R65Q) brains. One-way ANOVA, WT versus Aass (G489E), F(2,8) = 2.102, ***p = 0.0003; WT versus Aass (R65Q), p = 0.9219. WT, n = 4 brains; Aass (G489E), n = 4 brains; Aass (R65Q), n = 3 brains. Data are presented as mean ± SEM; n.s., no significance, p > 0.05, ***p < 0.001.
