Figure 3.

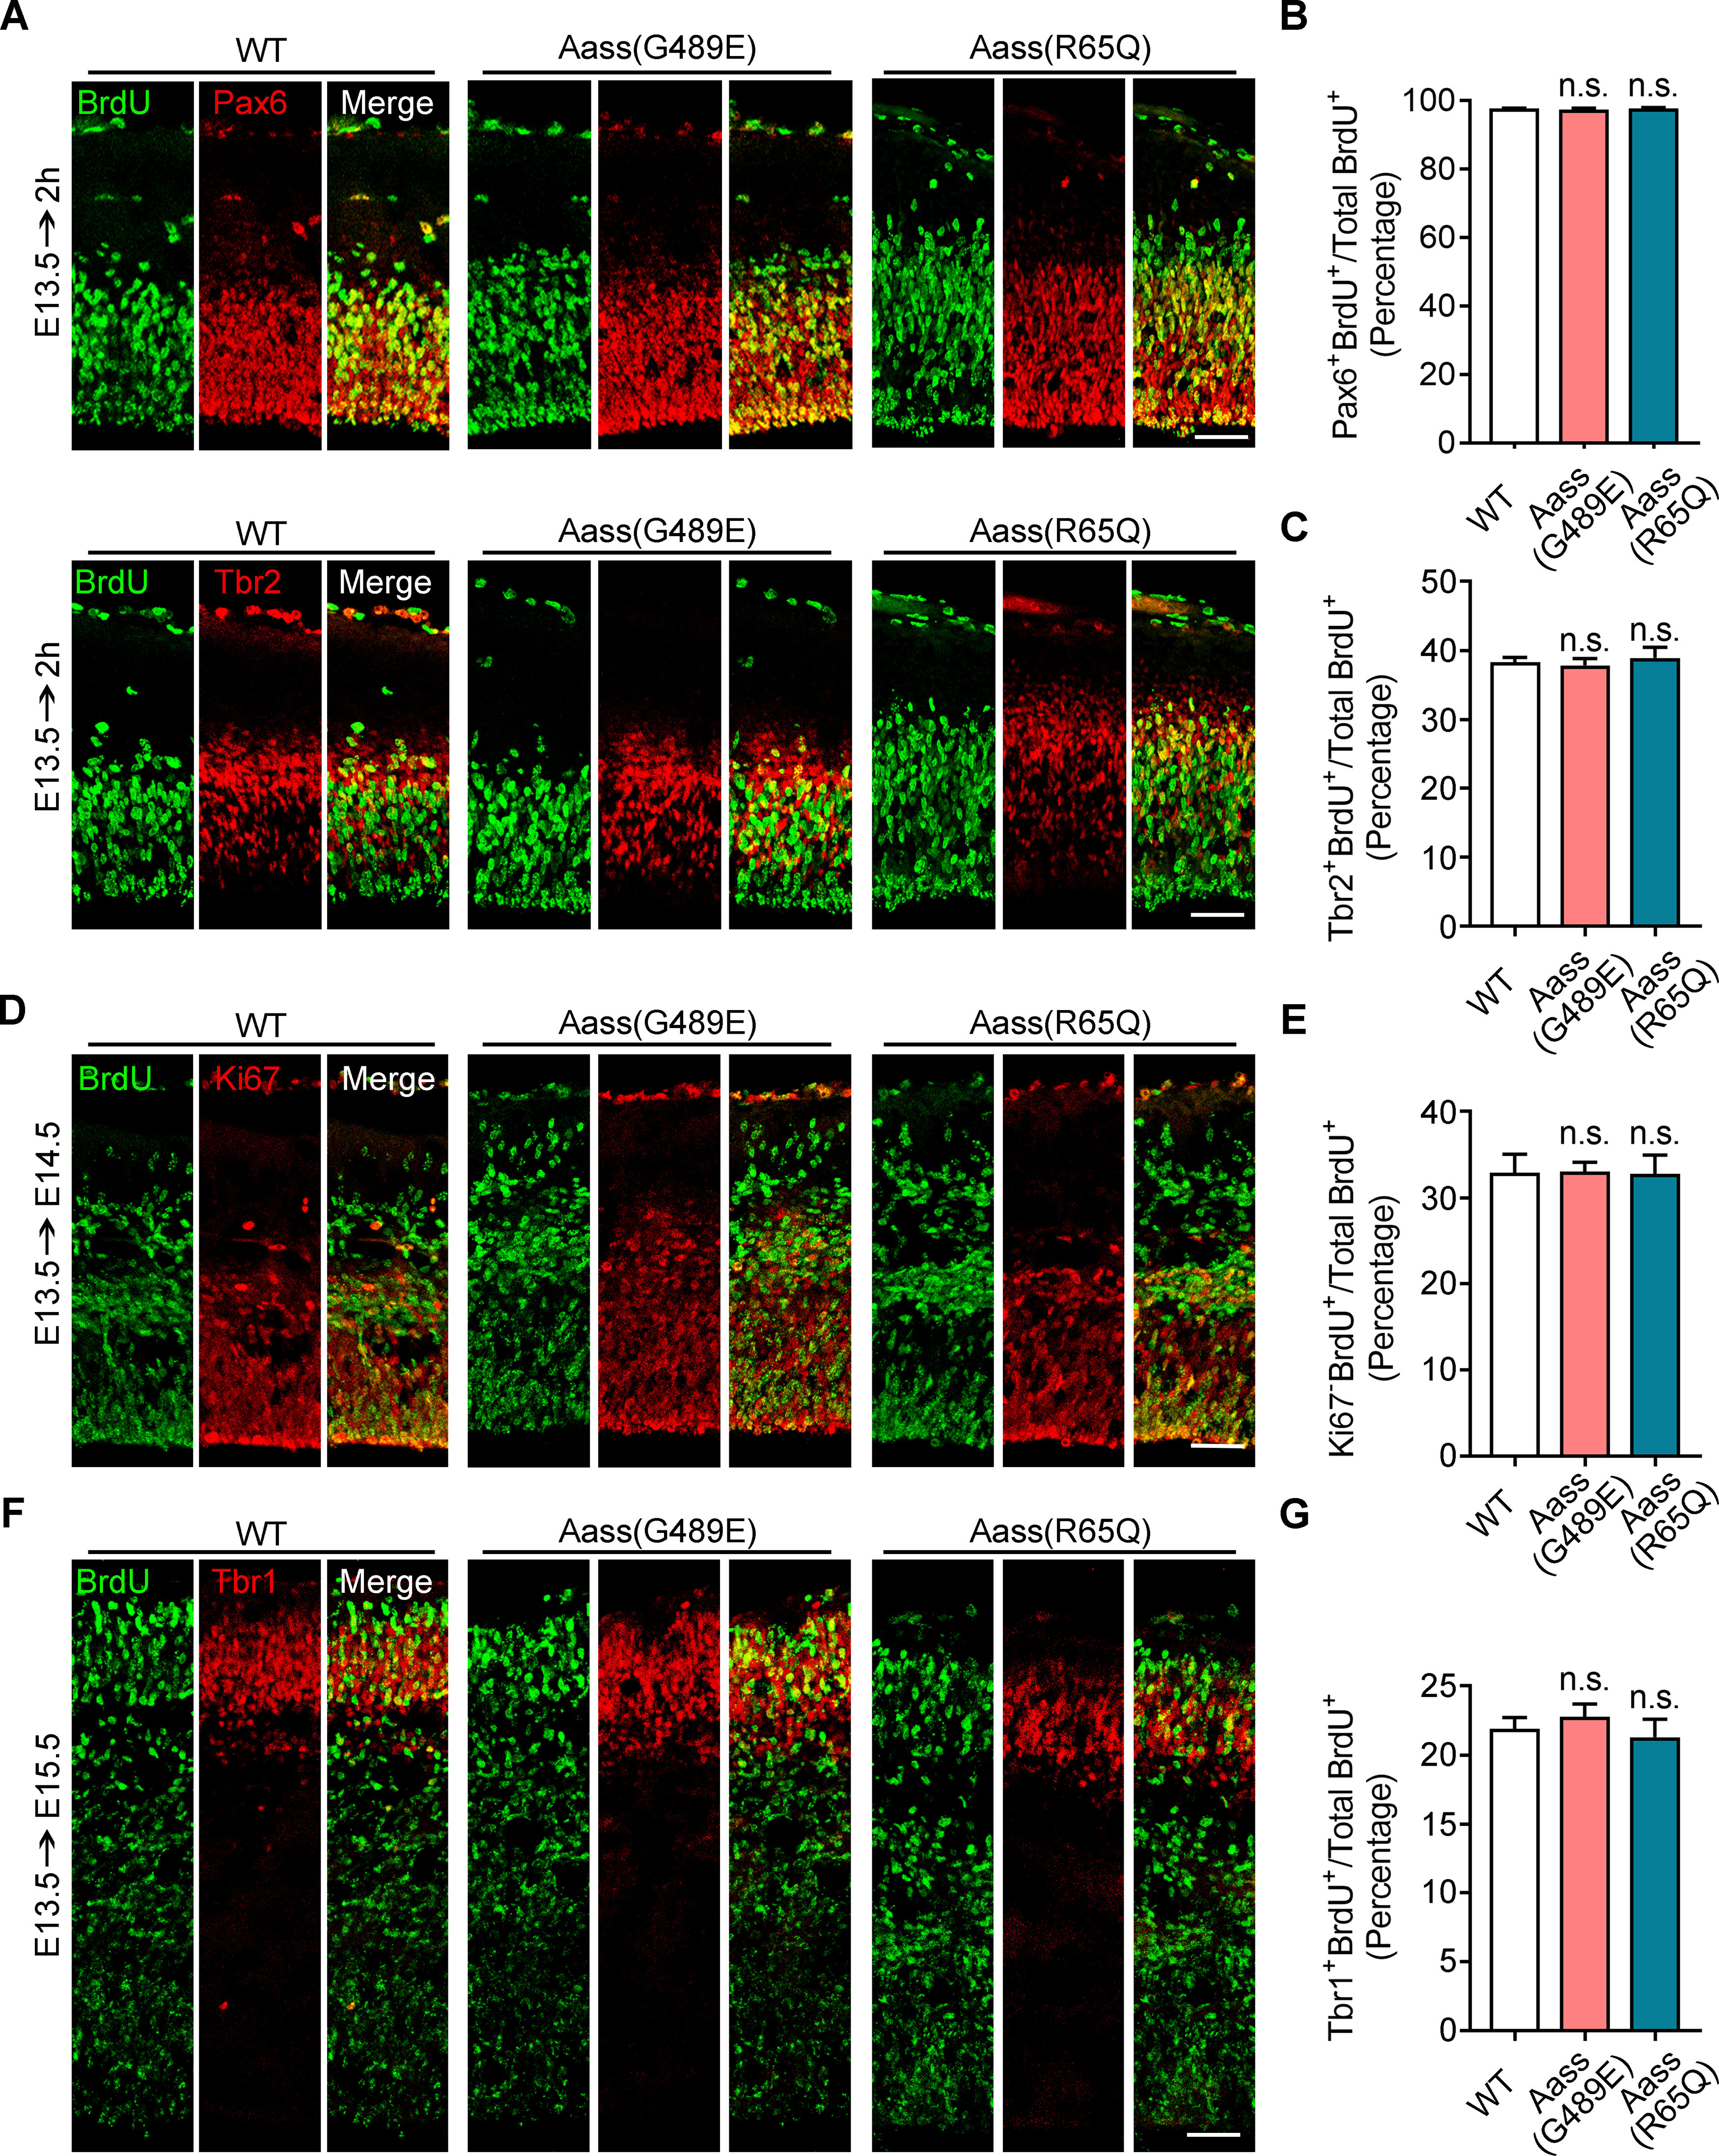
Mutations in LKR or SDH have no significant effect on the proliferation or differentiation of NPCs during embryonic brain development. A, Coronal sections of E13.5 WT, Aass (G489E), and Aass (R65Q) co-stained with anti-BrdU (green) and apical progenitor marker Pax6 (red) or intermediate progenitor marker Tbr2 (red) antibodies. Pregnant mouse were injected with BrdU at E13.5, and the brains of pups were harvested 2 h later. B, C, Quantification analysis of the fractions of Pax6+/BrdU+ cells (B) or Tbr2+/BrdU+ (C) among total BrdU+ cells. B, One-way ANVOVA, F(2,6) = 0.5960, WT versus Aass (G489E), p = 0.9496; WT versus Aass (R65Q), p = 0.9986. C, One-way ANVOVA, F(2,6) = 0.1216, WT versus Aass (G489E), p = 0.7101; WT versus Aass (R65Q), p = 0.5779. n = 3 brains. Scale bars: 100 μm. D, Coronal sections of E14.5 WT, Aass (G489E), and Aass (R65Q) co-stained with anti-BrdU (green) and cell division marker Ki67 (red) antibodies. E, Quantification analysis of the fractions of Ki67-/BrdU+ cells among total BrdU+ cells. One-way ANVOVA, F(2,6) = 0.4138, WT versus Aass (G489E), p = 0.9980; WT versus Aass (R65Q), p = 0.9988. n = 3 brains. Scale bars: 100 μm. F, Coronal sections of E15.5 WT, Aass (G489E), and Aass (R65Q) co-stained with anti-BrdU (green) and newly generated projection neurons marker Tbr1 (red) antibodies. G, Quantification analysis of the fractions of Tbr1+/BrdU+ cells among total BrdU+ cells. One-way ANVOVA, F(2,6) = 0.6478, WT versus Aass (G489E), p = 0.8953; WT versus Aass (R65Q), p = 0.9421. n = 3 brains. Scale bars: 100 μm. Data are presented as mean ± SEM; n.s., no significance, p > 0.05.
