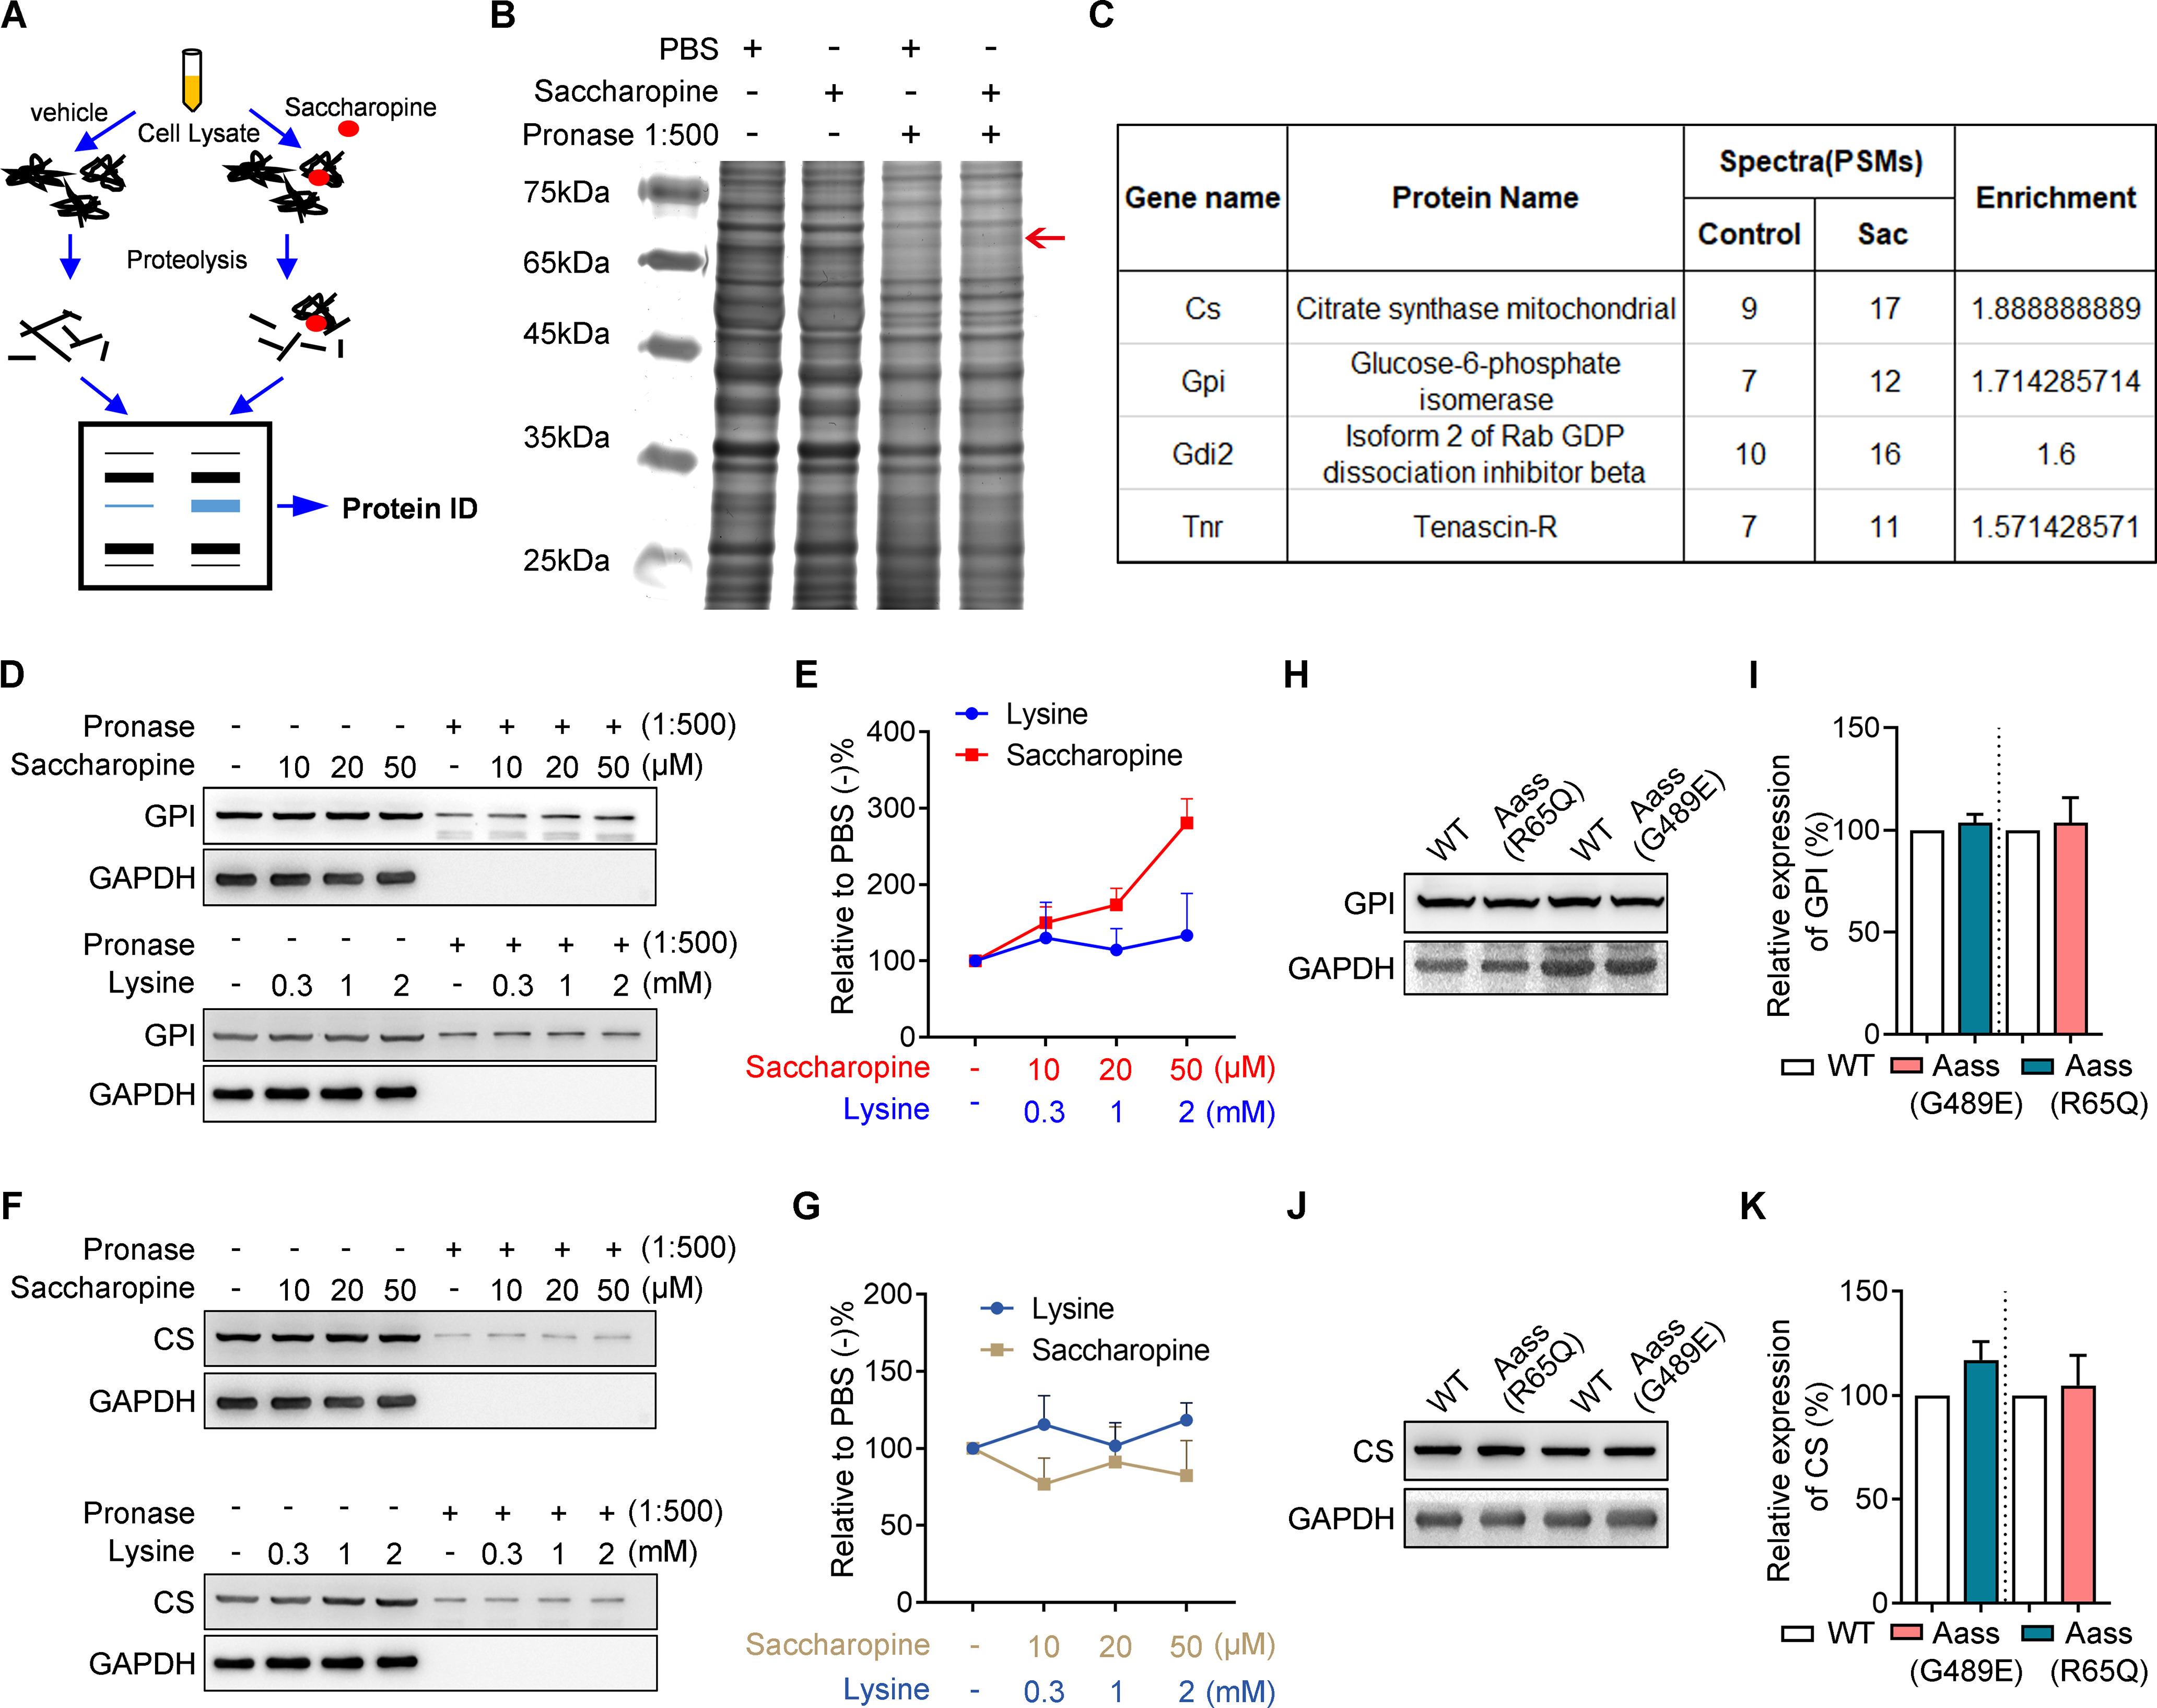
Figure 7.

Identification of putative saccharopine molecular target by DARTS assay. A, Scheme of DARTS. B, Sliver staining of SDS-PAGE gel in DARTS assay. The cerebral cortex lysates were treated with saccharopine, followed by Pronase digestion and silver staining. Red arrow, protected bands. C, Enrichment proteins in the protected band from B were revealed by mass spectrometry analysis. D, Western blotting analyzes the enrichment of GPI in DARTS assay. The brain lysates treated with saccharopine or lysine, digested with Pronase and then analyzed by Western blotting. E, Normalized grayscale value of GPI in D. The protein levels of GPI were normalized to PBS-treated groups. Data from three independent experiments. F, Western blotting analyzes the enrichment of CS in DARTS assay. The brain lysates treated with saccharopine or lysine, digested with Pronase and then analyzed by Western blotting. G, Normalized grayscale value of CS in F. The protein levels of CS were normalized to PBS-treated groups. Data from 3 independent experiments. H, Western blotting showing the expression of GPI in brain lysates. I, Quantitative analysis of the greyscale of GPI in H. Protein levels were normalized to GAPDH. The ratio in WT was set to 100%. WT, n = 4 brains; Aass (G489E), n = 4 brains; Aass (R65Q), n = 4 brains. J, Western blotting showing the expression of CS in brain lysates. K, Quantitative analysis of the greyscale of CS in J. Protein levels were normalized to GAPDH. The ratio in WT was set to 100%. WT, n = 4 brains; Aass (G489E), n = 4 brains; Aass (R65Q), n = 4 brains. Data are presented as mean ± SEM.
