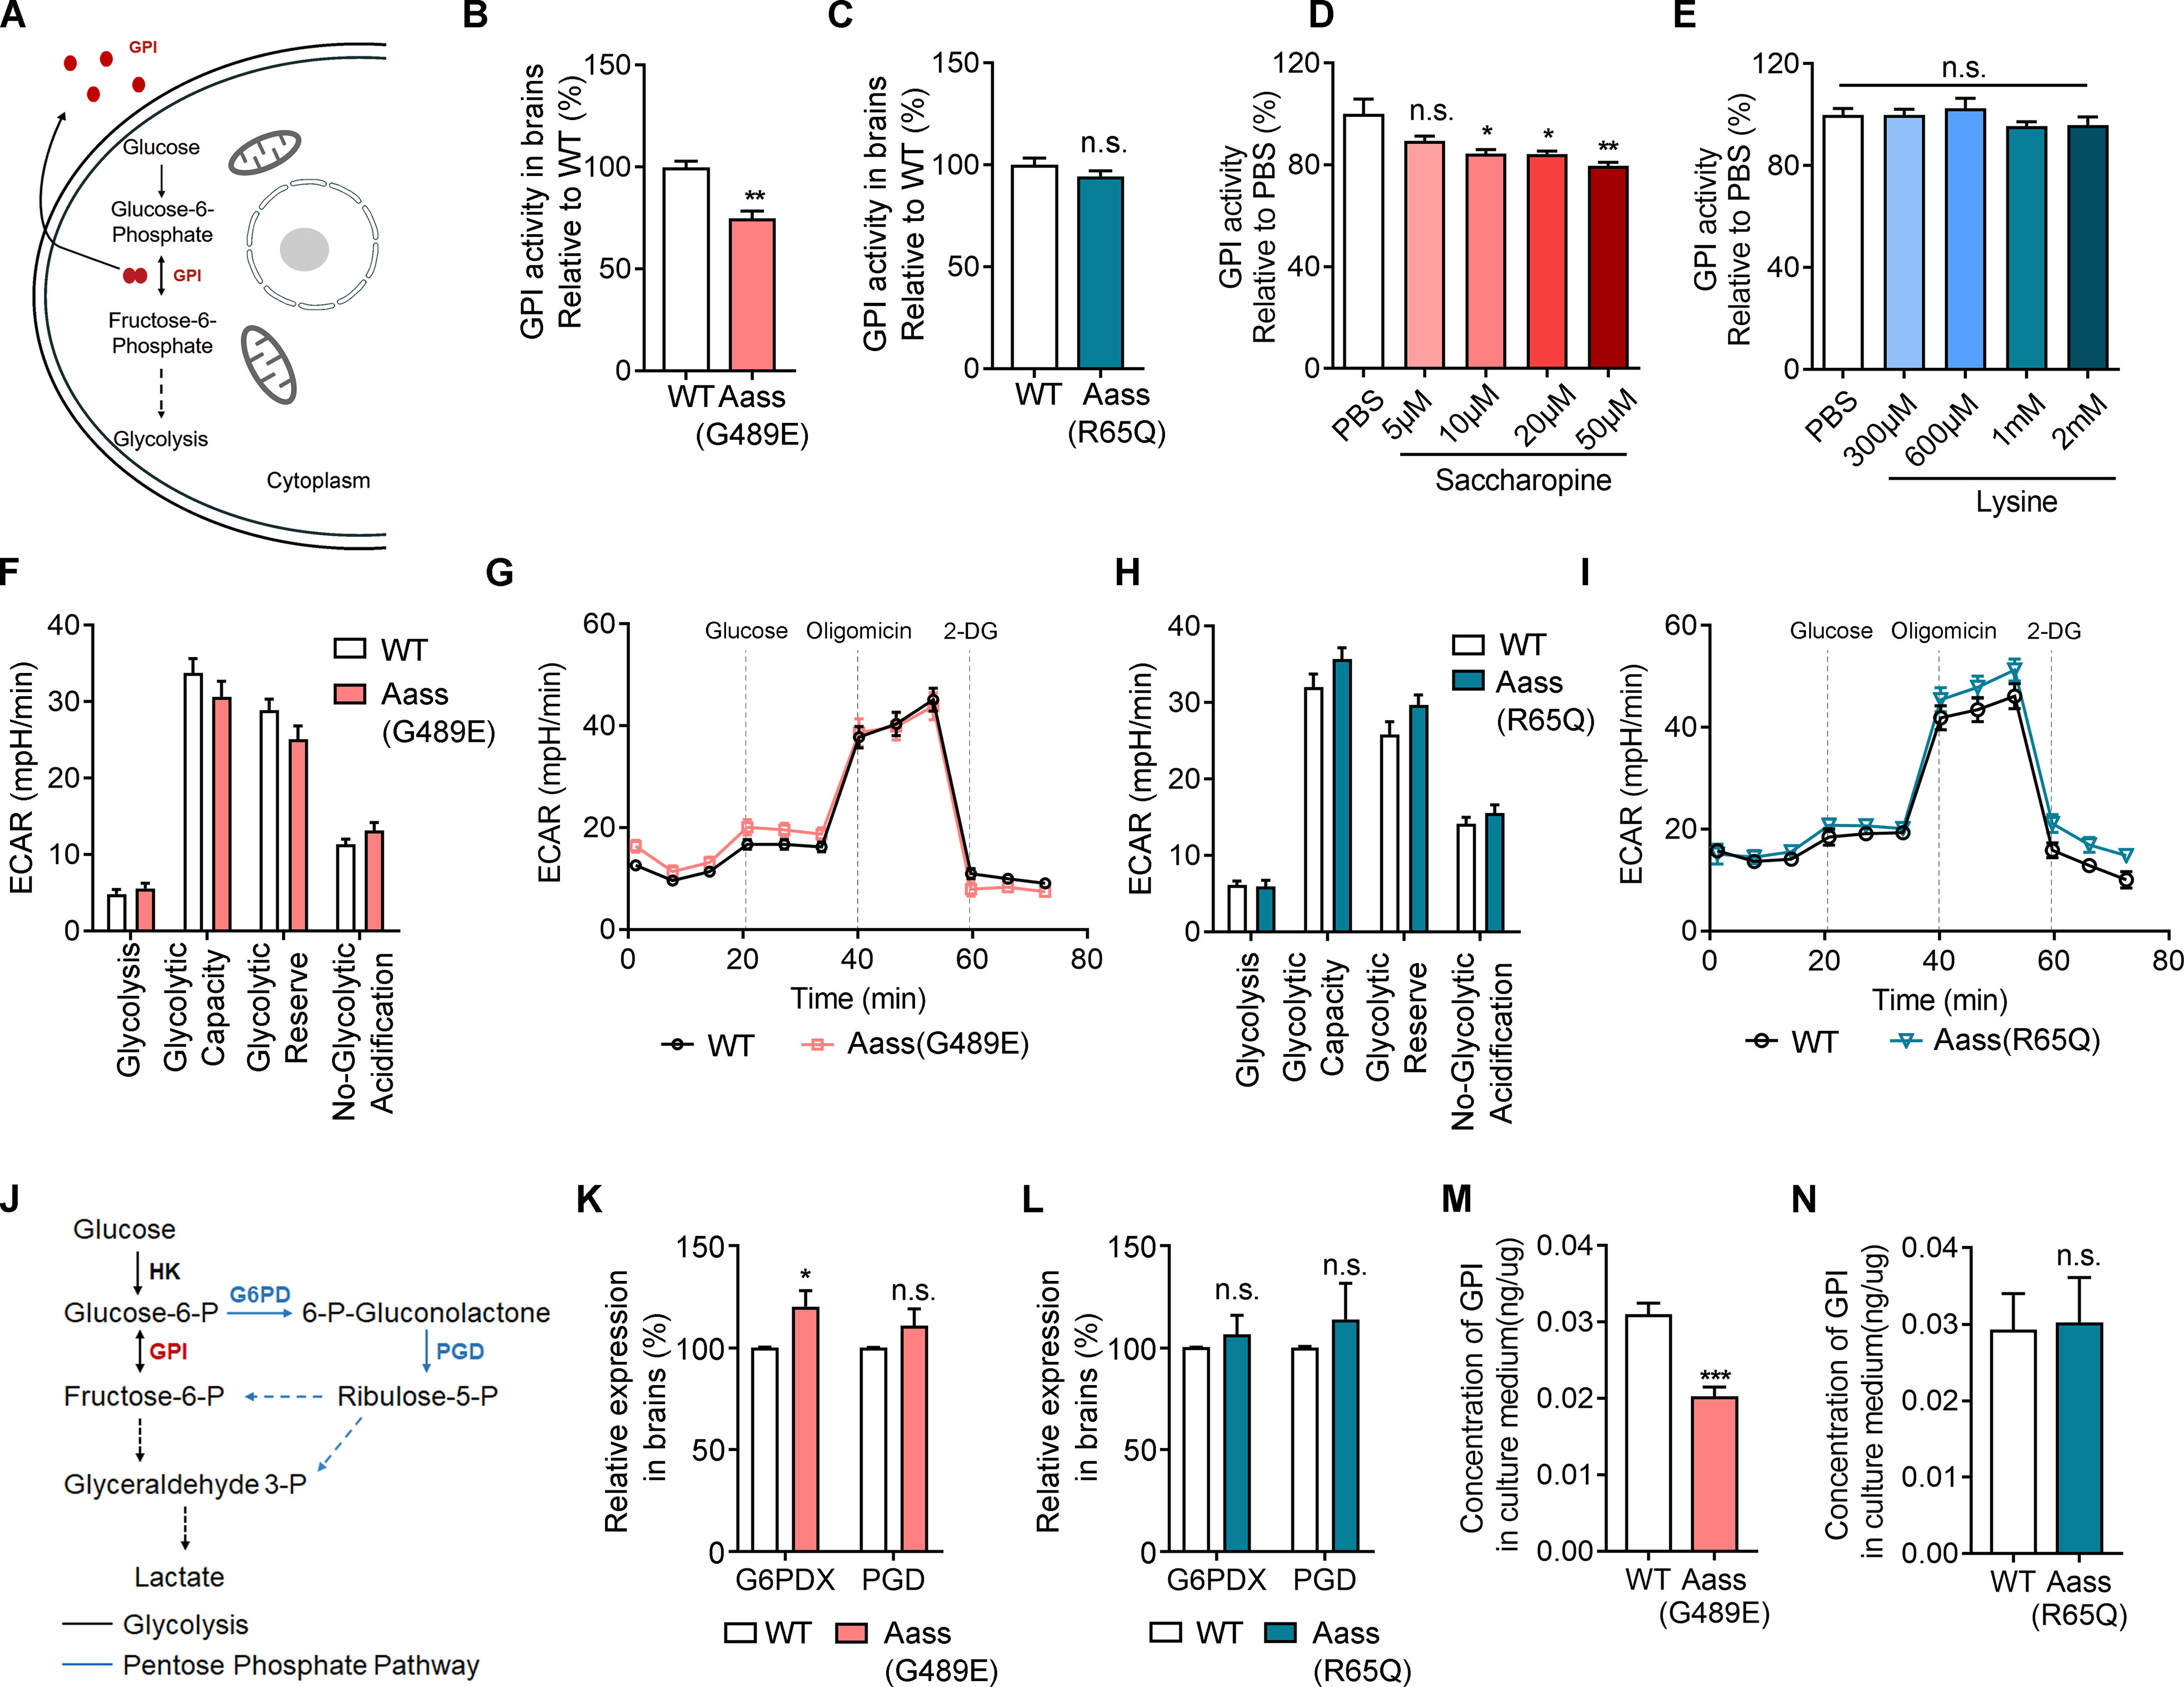
Figure 8.

SDH mutation results in reduced extracellular levels of GPI. A, Schematic illustration of GPI involved in glycolysis intracellularly or secreted into extracellular domain in an autocrine manner. B, C, The enzyme catalytic activity of GPI in cerebral cortex of WT, Aass (G489E) (B, Student's t test, **p = 0.001) or Aass (R65Q) mice (C, Student's t test, p = 0.3217). The ratio in WT mice was set to 100%. WT, n = 4 brains; Aass (R65Q), n = 4 brains; Aass (G489E), n = 4 brains. D, E, The enzyme catalytic activity of GPI in WT cortex lysates. The cortex lysates were treated with saccharopine (D) or lysine (E) in different concentrations as indicated. D, One-way ANOVA, PBS versus saccharopine 5 μm, p = 0.1596; PBS versus saccharopine 10 μm, *p = 0.0256; PBS versus saccharopine 20 μm, *p = 0.0242; PBS versus saccharopine 50 μm, **p = 0.0046. E, One-way ANOVA, PBS versus lysine 300 μm, p = 0.9999; PBS versus lysine 600 μm, p = 0.9741; PBS versus lysine 1 mm, p = 0.7953; PBS versus lysine 2 mm, p = 0.8453. F, Graph showing glycolysis, glycolytic capacity, glycolytic reserve, and nonglycolytic acidification of cortex neurons of Aass (G489E) mice compared with cortex neurons of WT littermates. G, Representative profile of glycolysis stress assay showing the ECAR of the cultured neurons isolated from WT and Aass (G489E) cortex. WT, n = 3 brains; Aass (G489E), n = 3 brains. H, Graph showing glycolysis, glycolytic capacity, glycolytic reserve and nonglycolytic acidification of cortex neurons of Aass (R65Q) mice compared with cortex neurons of WT littermates. I, Representative profile of glycolysis stress assay showing the ECAR of the cultured neurons isolated from WT and Aass (R65Q) cortex. WT, n = 3 brains; Aass (R65Q), n = 3 brains. J, Simplified schematic of glycolysis and the PPP. HK, hexokinase; GPI, Glucose-6-phosphate isomerase; G6PD, glucose-6-phosphate dehydrogenase; PGD, 6-phosphogluconate dehydrogenase. K, L, Relative expression profiles of G6PD and PGD in Aass (G489E) (K, Student's t test, G6PDX, *p = 0.0417; PGD, p = 0.2394) or Aass (R65Q) (L, Student's t test, G6PDX, p = 0.2473; PGD, p = 0.1943) cortices compared with their WT littermate cortices at P42. WT, n = 4 brains; Aass (G489E), n = 4 brains; Aass (R65Q), n = 4 brains. M, N, The concentration of secreted GPI in the culture medium of primary neurons dissected from Aass (G489E) (M, Student's t test, ***p = 0.0005) or Aass (R65Q) (N, Student's t test, p = 0.9048) brains compared with their WT littermates by ELISA. WT, n = 4 brains; Aass (G489E), n = 4 brains, Aass (R65Q), n = 4 brains. Data are presented as mean ± SEM, n.s., no significance, p > 0.05, *p < 0.05, **p < 0.01, ***p < 0.001.
