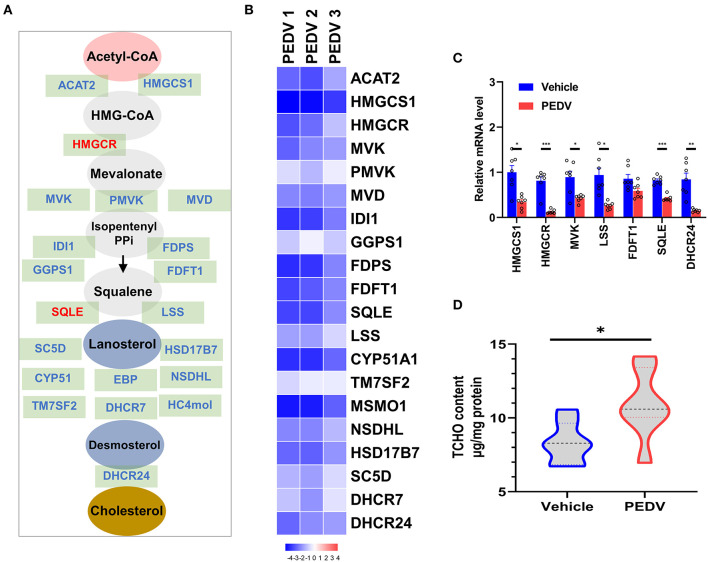
Figure 2.
The expression of genes in the cholesterol biosynthesis pathway and cholesterol content in piglet livers. (A) The graphic scheme of the cholesterol biosynthesis pathway from acetyl-CoA. The core genes involved in cholesterol biosynthesis were highlighted in blue, while two rate-limiting enzymes 3-hydroxy-3-methylglutaryl-CoA reductase (HMGCR) and SQLE were highlighted in red. (B) Heatmap of messenger RNA (mRNA) expression (RNA-seq) changes of the cholesterol biosynthesis genes in the livers of PEDV-infected piglets (log2 transformed, normalized to Control). (C) The qRT-PCR analysis confirmed changes of the cholesterol biosynthesis genes in the livers of PEDV-infected piglets. (D) Total cellular cholesterol contents in the livers of the control and PEDV-infected piglets were analyzed and normalized to total protein concentrations. The data are shown as the means ± SEM, *P < 0.05, ** P < 0.01, ***P < 0.001, using the two-tailed Student t-test.

