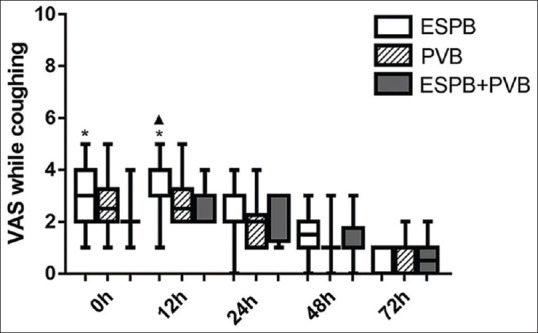
Figure 3.

Visual Analogue Scale while coughing. Data are expressed as median (horizontal bar), interquartile range (box) and the maximum and minimum values (whiskers). *P < 0.0167 when erector spinae plane block compared with P + E at 0 h and 12 h (P = 0.015, P < 0.001). ▴P < 0.0167 when erector spinae plane block compared with paravertebral block at 12 h (P = 0.002)
