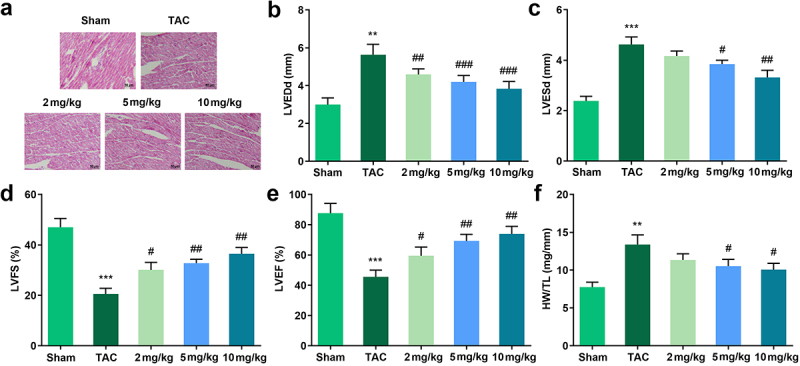
Figure 2.

Effects of Tan IIA on cardiac hypertrophy in vivo. (a) HE staining was performed to evaluate the pathological changes of myocardial structure. (b–e) Echocardiography was used to evaluate the cardiac function. (f) HW/TL was calculated in each group. **P < 0.05 vs. control group, ***P < 0.001 vs. control group, #P < 0.05 vs. Ang II group, ##P < 0.01 vs. Ang II group, ###P < 0.001 vs. Ang II group.
