
Figure 6.
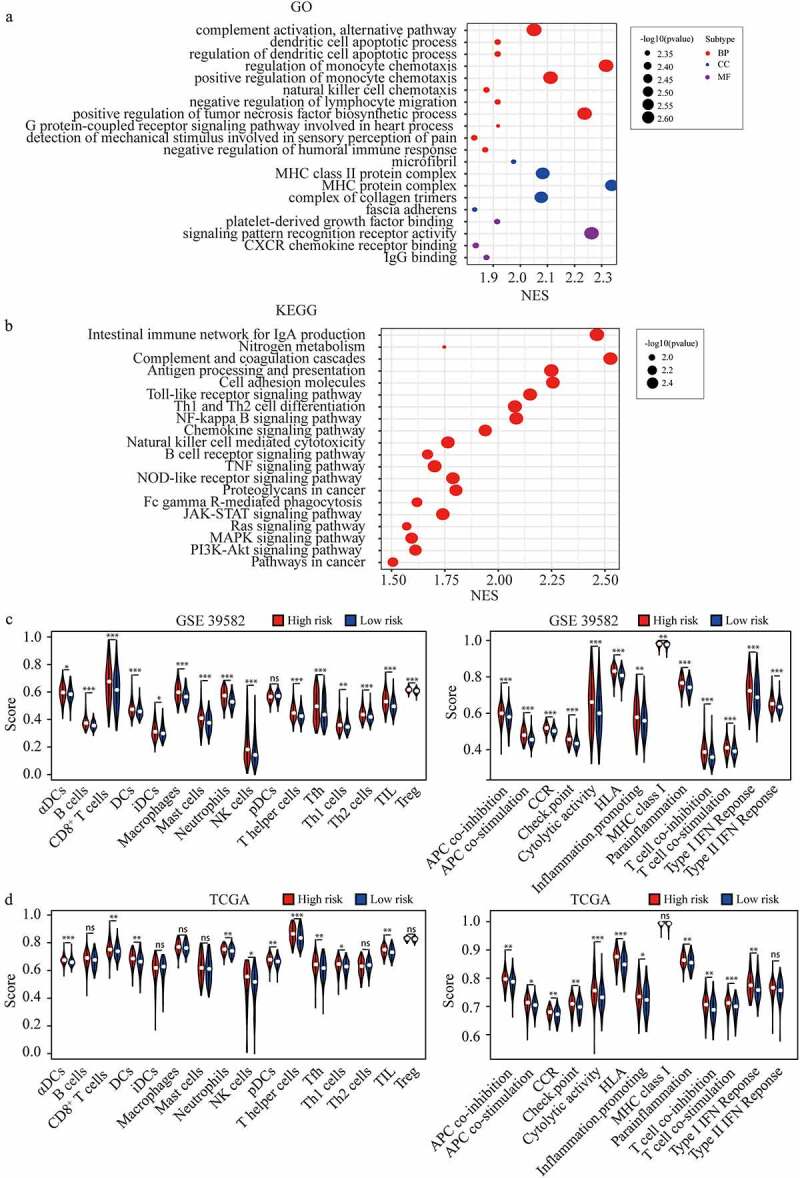
Pathway analysis and ssGSEA scores comparison between the high and low-risk groups. (a-b) GO terms (a) and KEGG pathway analysis in GSEA enrichment. (c-d) The scores of 16 immune cells and 13 immune-related functions in high and low-risk group in GSE 39582 (c) and TCGA dataset (d).