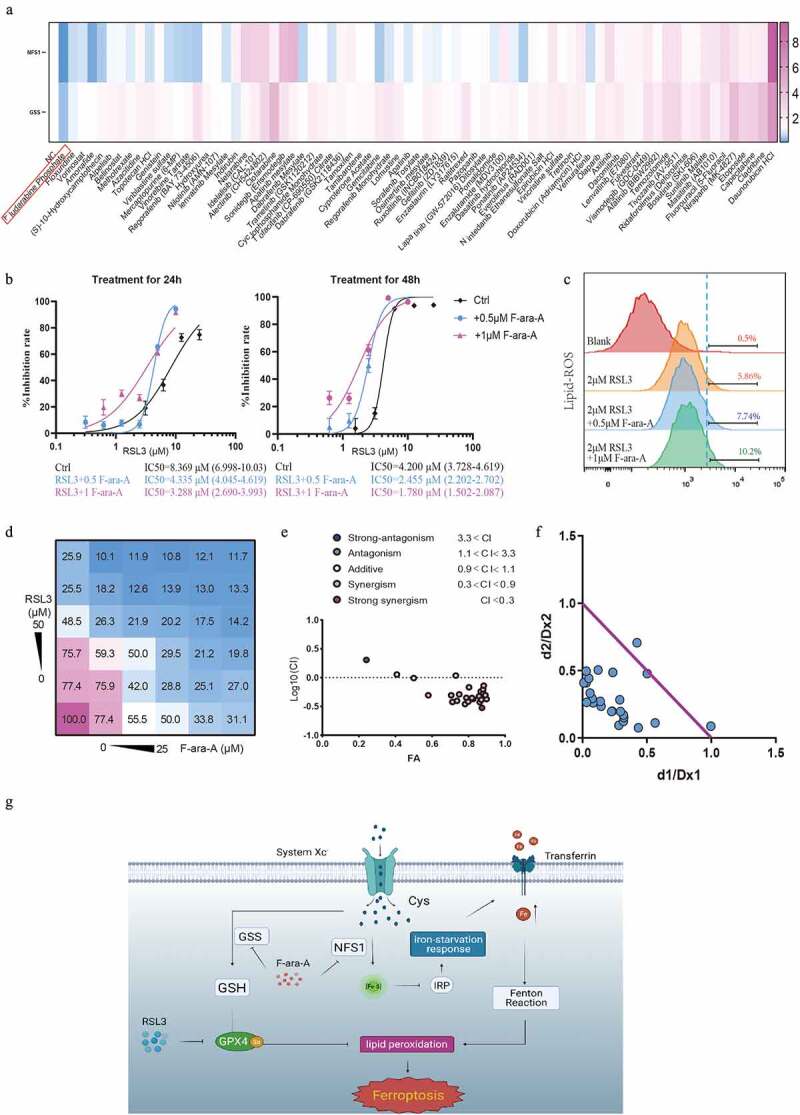
Figure 8.

Fludarabine phosphate has a synergistic effect in combination with RSL3. (a)Heat map of mRNA expression levels of NFS1 and GSS in Caco2 cell lines following treatment of 78 FDA-approved drugs for 48hours (The working concentrations were determined based on the Selleck website). (b) Cell viability of Caco2 cells after treatment of 0.5μM or 1μM Fludarabine Phosphate combined with RSL3 (0, 0.625, 1.25, 2.5, 5 and 10μM) for 24 or 48 hr. (c) Identification by flow cytometry of C11-BODIPY fluorescence in Caco2 treated with 2μM RSL3 combined with 0.5μM or 1μM Fludarabine Phosphate for 24 hr. (d) Heatmap showing the cell viability of Caco2 cell after RSL3 and Fludarabine Phosphate combination treatment. (e)Synergy of RSL3 and the Fludarabine Phosphate assessed by TING-CHAO CHOU combination index (CI). The x-axis represents inhibi-tion effect, and the yaxis represents log10(CI, Combination Index). ACI of less than 1 means that the two drugs have asynergistic effect. (f) The horizontal and vertical co-ordinates represent the fractional inhibition effect of the two drugs (Dx1 (RSL3), and Dx2 (Fludarabine Phosphate)) standardized concentrations alone. The purple line dis-played is the line of additivity. (g) The working model depicting the synergistic effect of RSL3 and the Fludarabine Phosphate on CRC cells.
