
Figure 1.
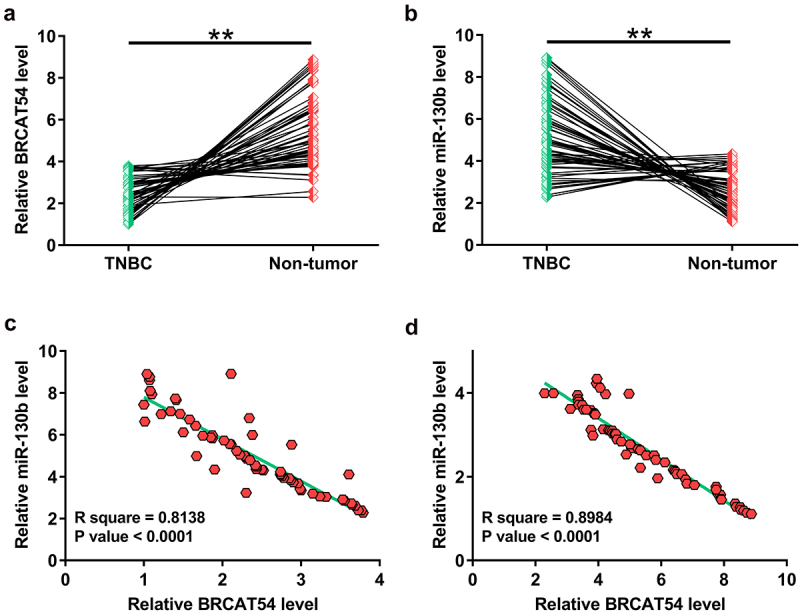
Analysis of the differential expression of BRCAT54 and miR-130b and their correlations.
The determination of BRCAT54 (A) and miR-130b (B) expression in paired tissues from 64 TNBC patients was analyzed by RT-qPCR. Correlation analysis with Pearson’s correlation coefficient was performed to analyze the correlation between BRCAT54 and miR-130b across TNCB tissues (C) and non-tumor tissues (D). **, p < 0.01.