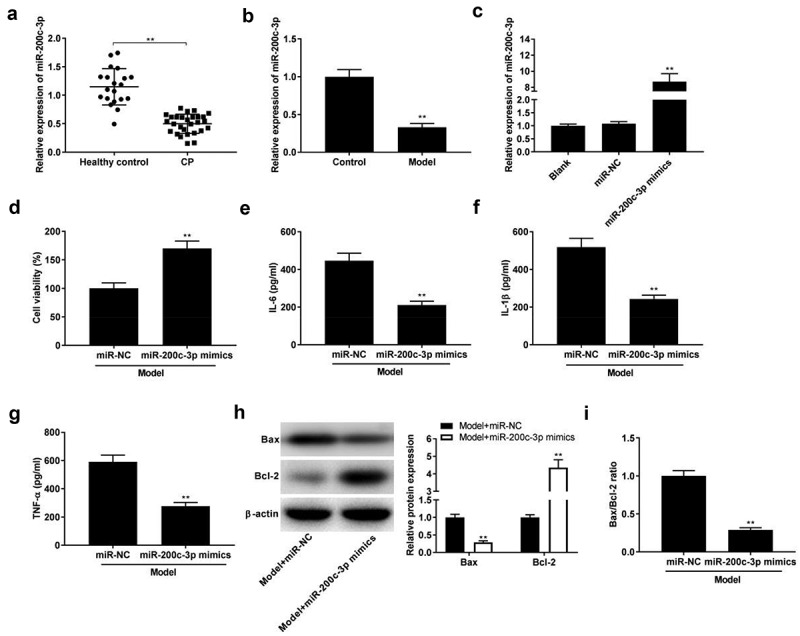
Figure 3.

Over-expression of miR-200c-3p inhibits inflammatory response in model group. (a) The expression of miR-200c-3p in healthy control individuals and CP tissues. **P < 0.01 vs. healthy control. (b) The expression of miR-200c-3p in model group. **P< 0.01 vs. control. (c) The expression of miR-200c-3p was detected by qRT-PCR after transfection of miR-NC and miR-200c-3p mimics. **P < 0.01 vs. miR-NC. (d-g) Cell viability and the levels of IL-6, IL-1β, and TNF-α in model + miR-NC and model + miR-200c-3p mimics groups. **P< 0.01 vs. miR-NC. (h-i) Relative protein expression of Bax and Bcl-2, and the ratio of Bax/Bcl-2 in model + miR-NC and model + miR-200c-3p mimics groups. **P < 0.01 vs. miR-NC.
