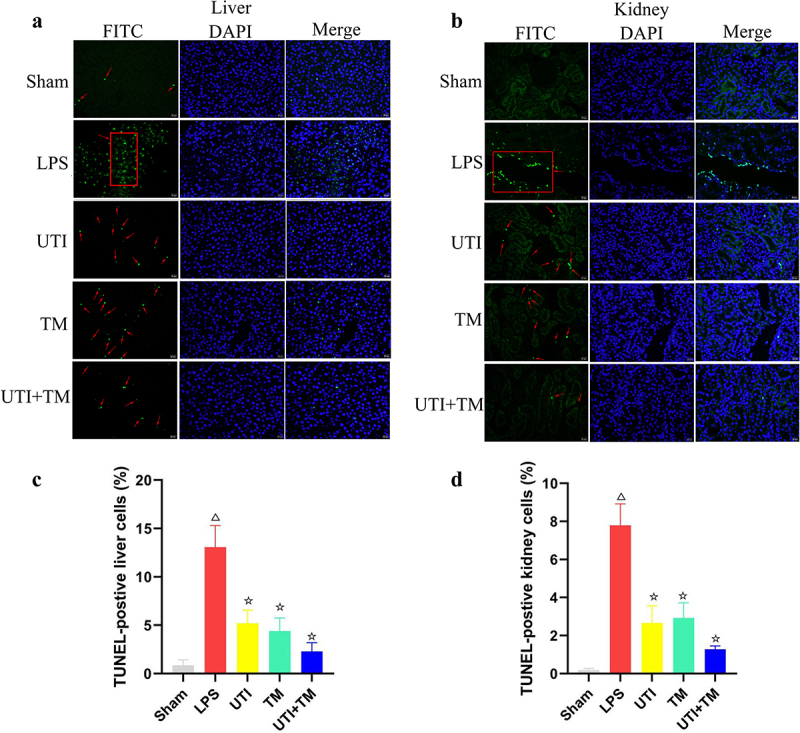
Figure 3.

Apoptosis in liver and kidney tissues were examined by TUNEL staining.
Nuclei were counterstained with DAPI (blue), and DNA fragmentation was measured by TUNEL (+) (green); the red arrows point to the apoptosis cells. (a) Representative images of TUNEL preformed on liver slices in five groups; (b) Representative images of TUNEL preformed on kidney slices in five groups; (c) Quantification of TUNEL-positive liver cells in sections of each groups; (d) Quantification of TUNEL-positive kidney cells in sections of each groups. ΔP < 0.05 vs. the Sham group, ☆P < 0.05 vs. the LPS group.
