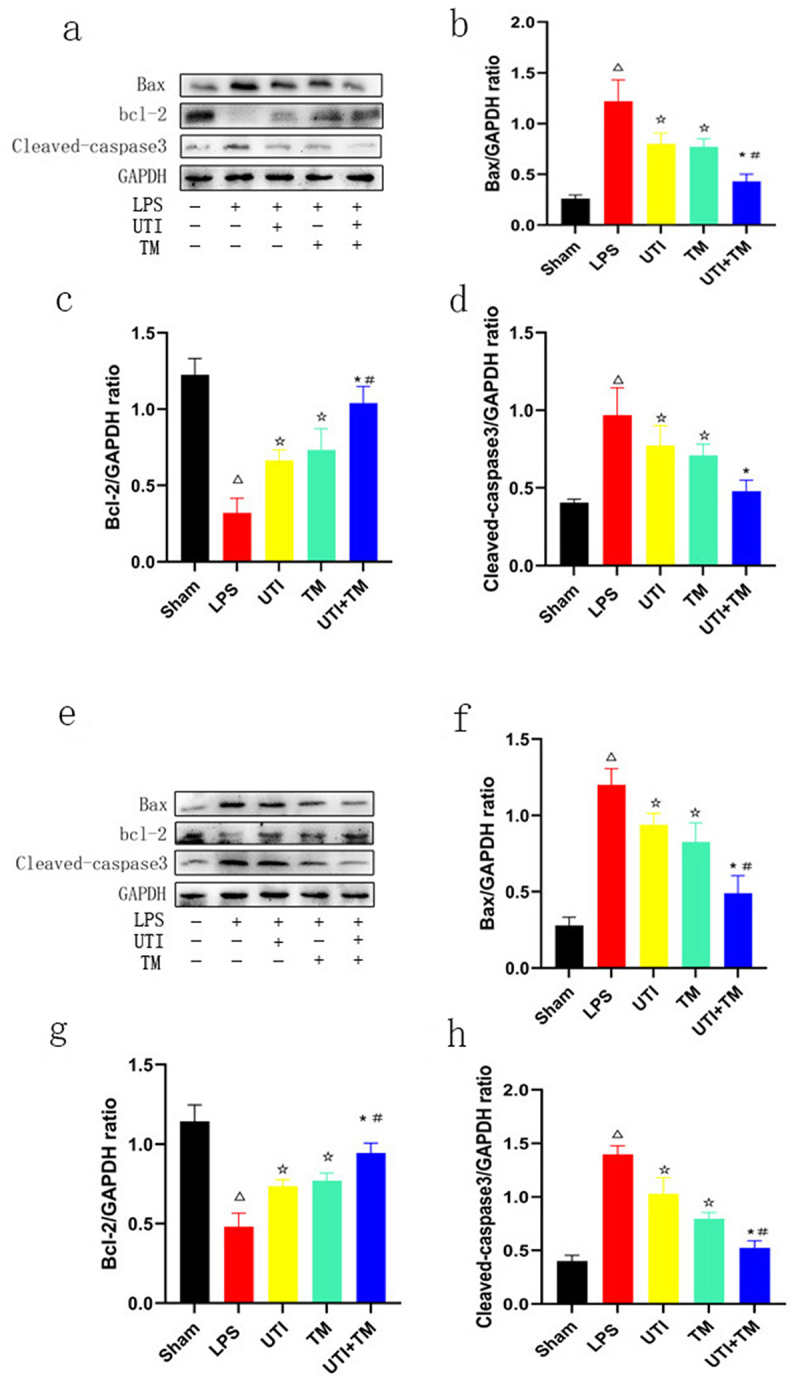
Figure 4.

Measure the expression levels of apoptosis-related proteins in liver and kidney tissues by Western blot.
(A) Protein levels of Bax, bcl-2 and Cleaved-caspase3 in liver tissues; (B) Densitometric analyses of Bax protein in liver tissues; (C) Densitometric analyses of bcl-2 protein in liver tissues; (D) Densitometric analyses of Cleaved-caspase3 protein in liver tissues; (E) Protein levels of Bax, bcl-2 and Cleaved-caspase3 in kidney tissues; (F) Densitometric analyses of Bax protein in kidney tissues; (G) Densitometric analyses of bcl-2 protein in kidney tissues; (H) Densitometric analyses of Cleaved-caspase3 protein in kidney tissues. GAPDH was used as the control to confirm equal protein loading. *P < 0.05 vs. the UTI group. #P < 0.05 vs. the TM group, ΔP < 0.05 vs. the Sham group, ☆P < 0.05 vs. the LPS group.
