
Figure 3.
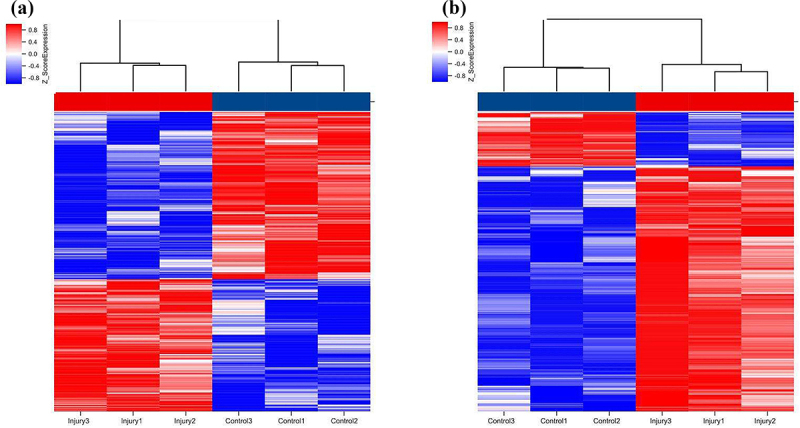
Hierarchical clustering of lncRNAs (a) and mRNAs (b) differentially expressed in the lung of smoke inhalation injury mice versus control mice. Heat maps showing significantly (absolute fold-change ≥ 2.0, P ≤ 0.05) regulated lncRNAs (a) and mRNAs (b). Three mice were analyzed in each group. Expression values are presented with the intensity of the color scheme, which ranges from blue to red, indicating low to high relative expression, respectively.