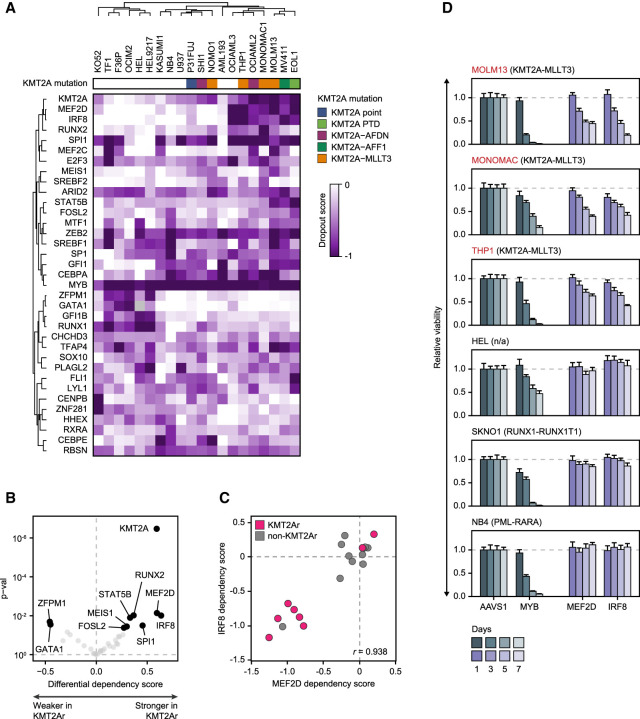
Figure 1.
A distinct transcriptional dependency profile of KMT2Ar AML. (A) A heat map of CRISPR dropout scores of 35 selective transcriptional AML dependencies clustered by Pearson correlation with complete linkage, demonstrating a distinct dependency pattern shared by the majority of KMT2Ar cell lines. (B) A volcano plot of differential average dependency scores of the 35 selective transcriptional AML dependencies between KMT2Ar and non-KMT2Ar cell lines. Darker color corresponds to P-value < 0.05. (C) Correlation between IRF8 and MEF2D dependency scores in AML cell lines. Negative scores reflect stronger dependency. (D) Validation of MEF2D and IRF8 as selective dependencies of KMT2Ar leukemia using three cell lines carrying a KMT2A translocation versus three non-KMT2Ar cell lines. The cells were electroporated with in vitro assembled Cas9/sgRNA complexes targeting the indicated TF genes, and cell viability was measured relative to an AAVS1 (“safe harbor”) control by quantification of ATP pools using a luciferin-based assay. Knockout efficiency was confirmed by Western blot. MYB targeting sgRNAs were used as a positive control.

