Figure 4.
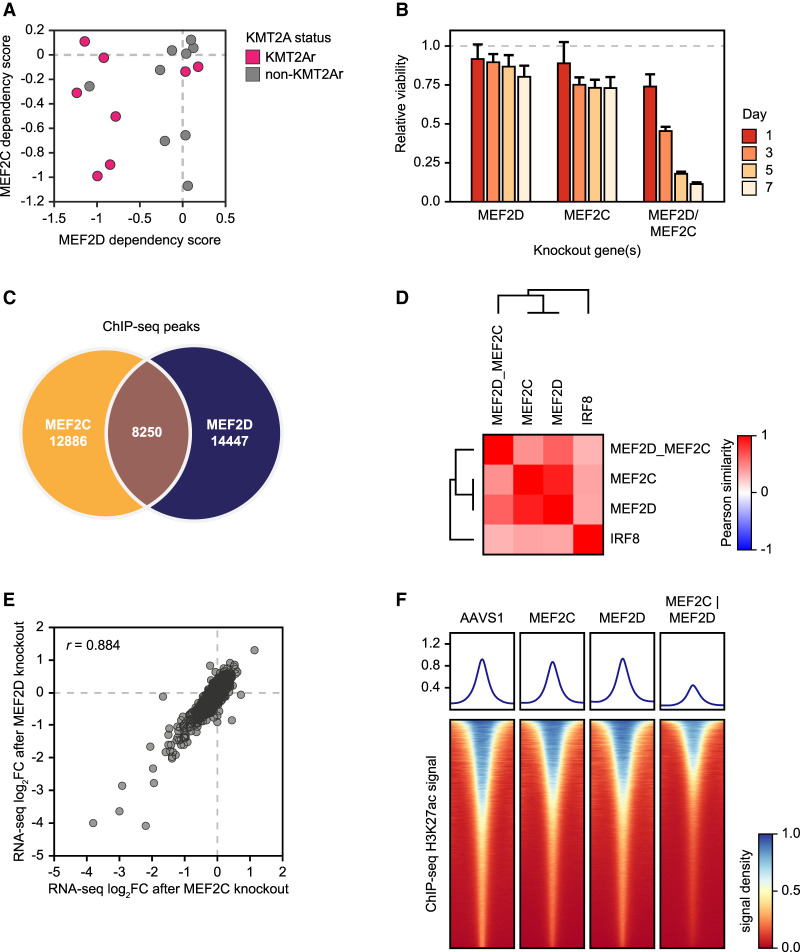
Functional redundancy of MEF2 paralogs. (A) A scatter plot of MEF2D/MEF2C dependency scores in AML cell lines. Negative scores correspond to stronger dependency. (B) Synthetic lethality of MEF2 paralogs. MV411 cells were electroporated with in vitro assembled Cas9/sgRNA complexes targeting one or both MEF2 paralogs as shown, and cell viability was measured relative to an AAVS1 (“safe harbor”) control by quantification of ATP pools using a luciferin-based assay. (C) Intersection of ChIP-seq peaks between MEF2D and MEF2C in MV411 cells. (D) A similarity matrix of TF knockouts hierarchically clustered by Pearson correlation between knockout-induced changes in the expression of the top 5000 expressed genes compared with the AAVS1 control. MV411 cells were electroporated with in vitro assembled Cas9/sgRNA complexes targeting the individual TFs as shown, as well as a simultaneous knockout of MEF2D and MEF2C, followed by RNA-seq. An AAVS1 (“safe harbor”) targeting sgRNA was used as a control. (E) Synergistic actions of MEF2D and MEF2C are illustrated by cross-plotting transcriptional responses of the top 5000 expressed genes to the MEF2D and MEF2C knockouts. (F) Changes in the genome-wide H3K27ac levels after designated TF knockouts, measured by quantitative ChIP-seq using an external spike-in control. Density plots depict genome-wide histone acetylation after the indicated TF knockouts. Each row visualizes spike-in-normalized ChIP-seq signal around a single H3K27ac peak.

