Figure 5.
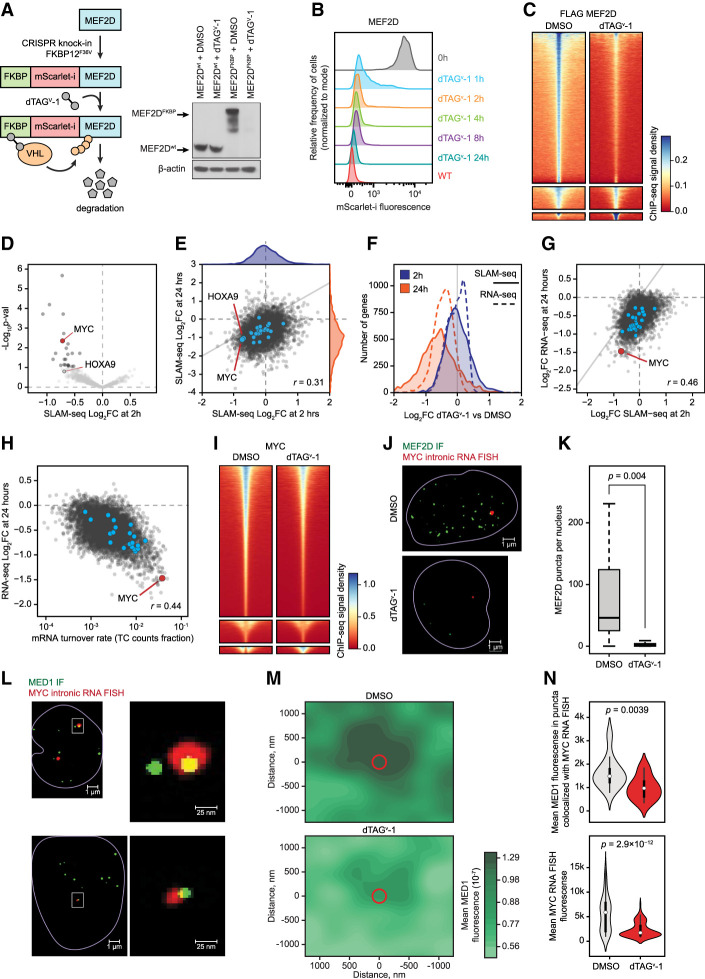
Direct transcriptional effects of MEF2D revealed by targeted degradation and SLAM-seq. (A) Schematic and Western blot of endogenous MEF2D tagging by CRISPR–HDR and subsequent targeted degradation of the fusion protein. (B) A time course of MEF2D degradation by FACS measurement of the fusion protein fluorescence. (C) Degradation of MEF2D reduces its genomic occupancy, as demonstrated by density plots of spike-in-controlled anti-Flag MEF2D ChIP-seq experiment showing genome-wide occupancy change after MEF2D degradation. Each row represents a single peak. (D) A volcano plot of genome-wide changes in nascent mRNA transcription measured by SLAM-seq after 2 h of MEF2D degradation. (E) A cross-plot of genome-wide changes in nascent mRNA transcription measured by SLAM-seq after 2 versus 24 h of MEF2D degradation demonstrates a poor correlation between early and late transcriptional responses, as well as signs of transcriptional collapse by 24 h. (F) A distribution plot of genome-wide changes in nascent transcription rates (SLAM-seq) and mRNA pools (RNA-seq) after 2 and 24 h of MEF2D degradation. (G) Correlation between changes in nascent RNA transcription (SLAM-seq) after 2 h of MEF2D degradation versus changes in the mRNA pools (RNA-seq) after 24 h of MEF2D degradation. (H) Correlation between steady-state mRNA turnover rates approximated from the SLAM-seq TC count fraction versus changes in the mRNA pools (RNA-seq) after 24 h of MEF2D degradation. (I) A density plot of spike-in-controlled anti-MYC ChIP-seq experiment demonstrating reduced genome-wide MYC occupancy after MEF2D degradation. (J) Degradation of MEF2D for 2 h results in a dramatic reduction of MEF2D puncta in the nucleus. (Green) MEF2D immunofluorescence (IF) signal, (red) intronic MYC RNA FISH signal. (K) Quantitative analysis of MEF2D puncta after degradation. (L) Degradation of MEF2D for 2 h results in decreased mediator recruitment and reduced MYC transcription. (Green) MED1 IF signal, (red) intronic MYC RNA FISH signal, (yellow) overlap between the red and green signals. (M) A density plot of multi-image analysis showing reduced mediator recruitment to foci of MYC transcription after degradation of MEF2D for 2 h. The green color gradient represents kernel density estimation of aggregate MED1 IF signal in a cubic region of 1400 nm3 centered on the MYC RNA FISH puncta in each cell. The red circle represents the average size of the MYC RNA FISH puncta. (N) Quantitative analysis of MED1 IF and MYC RNA FISH puncta before and after degradation demonstrating reduced mediator and RNA fluorescence at the sites of MYC transcription after MEF2D degradation for 2 h.

