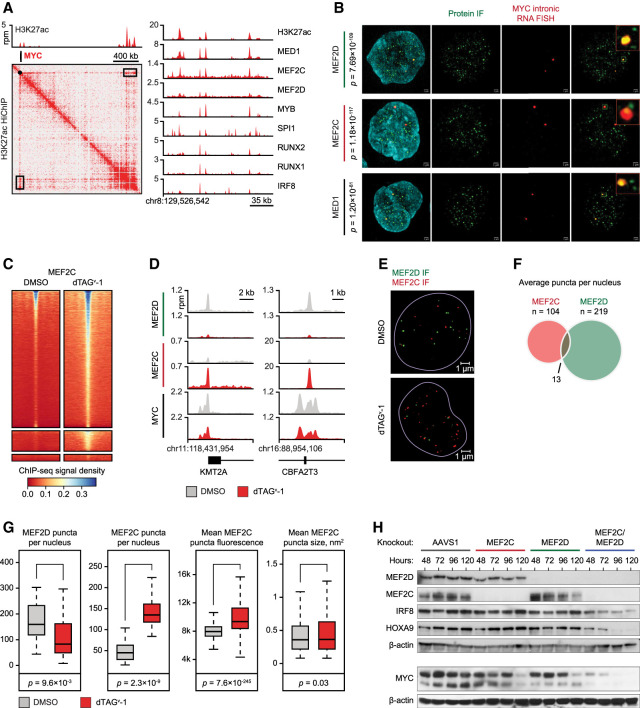
Figure 6.
Compensation and competition between MEF2D and MEF2C. (A) A 2D HiChIP plot illustrating H3K27ac-mediated DNA contacts in the MYC locus and ChIP-seq tracks of core regulatory TF binding at the MYC SE located ∼1.7 Mb downstream from the MYC promoter (black box on the HiChIP map). (B) SIM superresolution confocal microscopy of MV411 cells with simultaneous immunofluorescence using primary antibodies against the designated proteins and intronic RNA FISH targeting nascent MYC transcripts. P-values reflect significance of colocalization of protein puncta with RNA FISH calculated by Fisher exact test. (C) A density plot of a spike-in-controlled anti-MEF2C ChIP-seq experiment demonstrating increased MEF2C occupancy after MEF2D degradation. Each row represents a single peak called from an anti-Flag MEF2D ChIP-seq experiment in unperturbed MV411 cells. Color gradient reflects MEF2C ChIP-seq signal registered in the MEF2D peaks. (D) ChIP-seq tracks demonstrating changes in MEF2D, MEF2C, and MYC binding in two representative loci after MEF2D degradation. (E) MEF2D degradation results in an increased number and intensity of MEF2C nuclear puncta. The images demonstrate immunofluorescence with antibodies against MEF2D (green) and MEF2C (red) before and after MEF2D degradation. (F) Overlap between MEF2D and MEF2C puncta in unperturbed cells on multi-image analysis. (G) Quantitative multi-image analyses of MEF2D and MEF2C puncta before and after MEF2D degradation shows increased number and intensity of MEF2C condensates after MEF2D degradation. (H) Western blot demonstrating changes in TF protein levels after single and combined MEF2D/MEF2C knockouts by CRISPR/Cas9.

