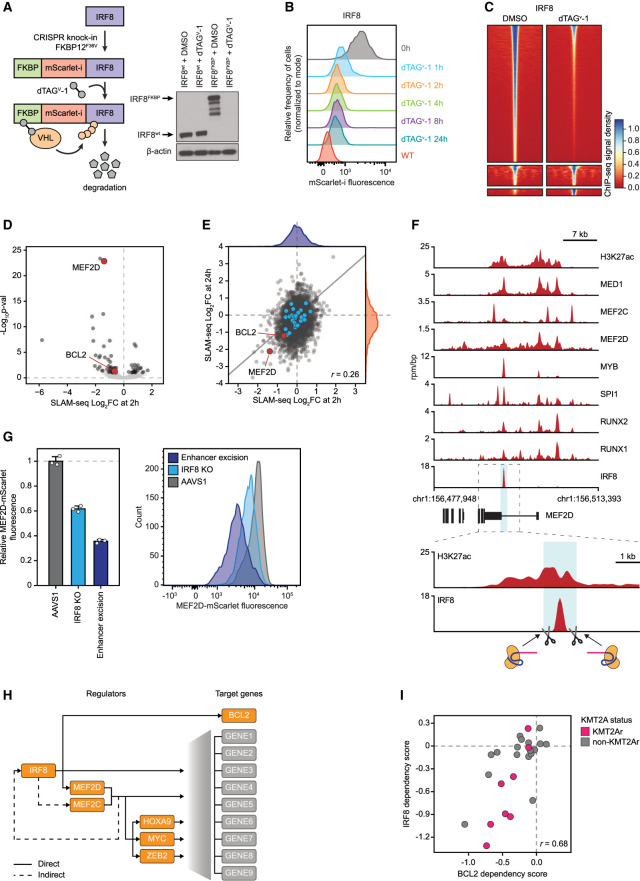
Figure 7.
IRF8 directly regulates MEF2D and BCL2. (A) Schematic and Western blot of endogenous IRF8 tagging by CRISPR–HDR and subsequent targeted degradation of the fusion protein. (B) A time course of IRF8 degradation by FACS measurement of the fusion protein fluorescence. (C) A density plot of spike-in-controlled anti-IRF8 ChIP-seq experiment showing reduced genome-wide occupancy after degradation. (D) A volcano plot of genome-wide changes in nascent mRNA transcription measured by SLAM-seq after 2 h of IRF8 degradation. (E) A cross-plot of genome-wide changes in nascent mRNA transcription measured by SLAM-seq after 2 versus 24 h of IRF8 degradation demonstrates a poor correlation between early and late transcriptional response. (F) ChIP-seq tracks of core regulatory TF binding at the MEF2D superenhancer and schematic of CRISPR/Cas9 strategy for IRF8 binding site excision. (G) Changes in the MEF2D protein levels measured by mScarlet reporter fluorescence after IRF8 gene knockout versus excision of the IRF8 binding site in the MEF2D locus. MV411 cells carrying the FKBP-mScarlet-MEF2D fusion were electroporated with Cas9/sgRNA complexes targeting the IRF8 gene, IRF8 binding site in the MEF2D SE, or AAVS1 control, respectively, and fluorescence was measured by FACS 72 h after electroporation. (H) Schematic of the direct and indirect regulatory relationships in the IRF8/MEF2 axis. (I) Correlation between BCL2 and IRF8 dependency scores in AML cell lines.

