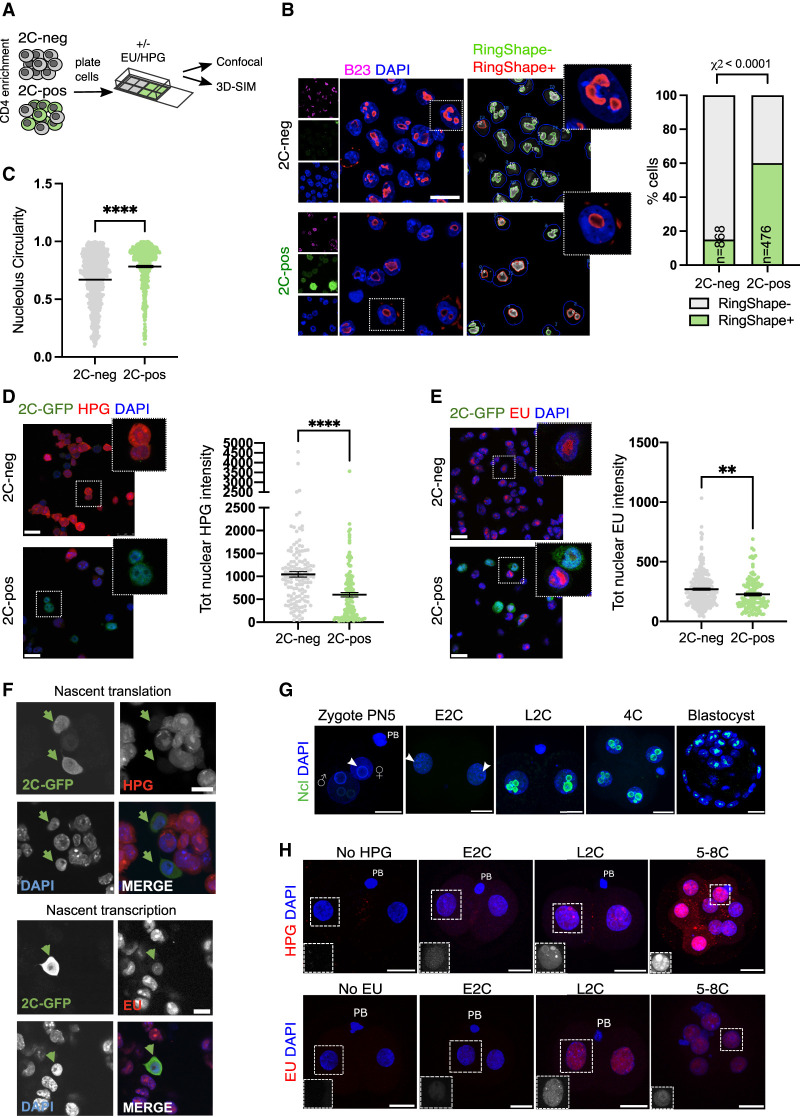
Figure 2.
2C-like cells and embryos have altered nucleolar morphology and function. (A) Experimental set-up for 2C-like cell profiling: Following CD4-based enrichment, 2C-neg/pos populations were plated into Matrigel-coated chambers for a minimum of 1 h before the indicated downstream applications. (B) Immunofluorescence images and quantification (RingShape+, CellProfiler) appearance in 2C-pos/neg cells, revealing that 2C-like cell nucleoli (2C-GFP, green), stained by the nucleolar marker B23 (Npm1, purple), have rounded, ring-like morphology. (n) Number of cells scored. Scale bar, 20 µm. (C) Nucleolar circularity is significantly increased in 2C-like cells. Very small nucleoli (area <100 pixels) were filtered out as can typically generate unreliable measurements (see the Materials and Methods). (D,E) Immunofluorescence images and quantification of nascent translation (D) and nascent transcription (E) rates in 2C-pos versus 2C-neg cells via HPG or EU Click-iT incorporation experiments, respectively. Scale bar, 25 µm. (F) Confirmation of reduced transcription and translation in 2C-like (2C-GFP+) cells within unsorted populations, using an independent 2C-GFP cell line (Percharde et al. 2018). Scale bar, 10 µm. (G) Nucleolar (nucleolin [Ncl]) staining in in vitro cultured embryos, showing the emergence of Ncl+ nucleoli at the late two-cell stage (L2C). (E2C) Early two-cell stage, (PB) polar body. White arrows denote NPBs. Scale bar, 20 µm. (H) Analysis of nascent transcription/translation in embryos by EU/HPG assays, respectively. Scale bar, 20 µm. Insets show EU/HPG staining alone (grayscale) in a representative blastomere from each image. P-values represent χ2 test (B) and two-tailed Student's t-test (C–E), with Welch's correction for uneven variance where relevant; data represent at least two independent experiments.

