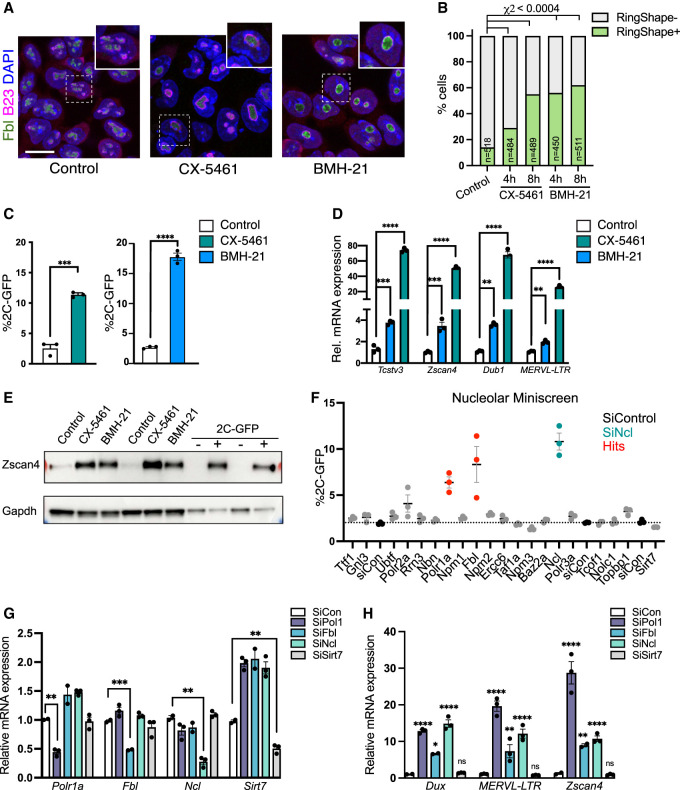
Figure 3.
Nucleolar disruption induces the 2C-like state. (A) Representative immunofluorescence images following staining for nucleolar markers (fibrillarin [Fbl]) and B23 4 h after RNA Pol I inhibition (iPol I) with either CX-5461 or BMH-21. Scale bar, 20 µm. (B) Quantification of the percentage of cells with ring-like (RingShape+) nucleoli 4 and 8 h after iPol I. P-values, χ2 test adjusted for multiple comparisons. (n) Number of cells. (C) Percentage of 2C-GFP+ cells following overnight (16- to 24-h) treatment with 0.25 µM iPol I. Data are mean ± SEM. n = 3 biological replicates representative of three or more experiments. (D) qRT-PCR analysis of 2C-specific genes and TEs following iPol I as in C, with P-values in C and D representing two-tailed t-test with two-stage multiple comparisons correction. (E) Western blots showing up-regulation of 2C-specific protein Zscan4 after 16- to 24-h iPol I in ESCs, shown next to purified 2C-GFP/CD4+/− cells. Replicates from two experiments are shown. (F) Flow cytometry analysis of percentage of 2C-GFP+ cells following siRNA knockdown of the indicated factors. Red samples indicate a Z-score of >1, with KD of Ncl shown as a positive control (teal). Data are mean ± SEM of three biological replicates, representative of two repeats of the screen. (G,H) Validation by qRT-PCR of siRNA-mediated knockdown of the indicated factors (G) and up-regulation of 2C-specific genes (H) showing mean ± SEM of n = 2–3 biological replicates, representative of two experiments. P-values, two-way ANOVA followed by Dunnett's multiple comparisons test.

