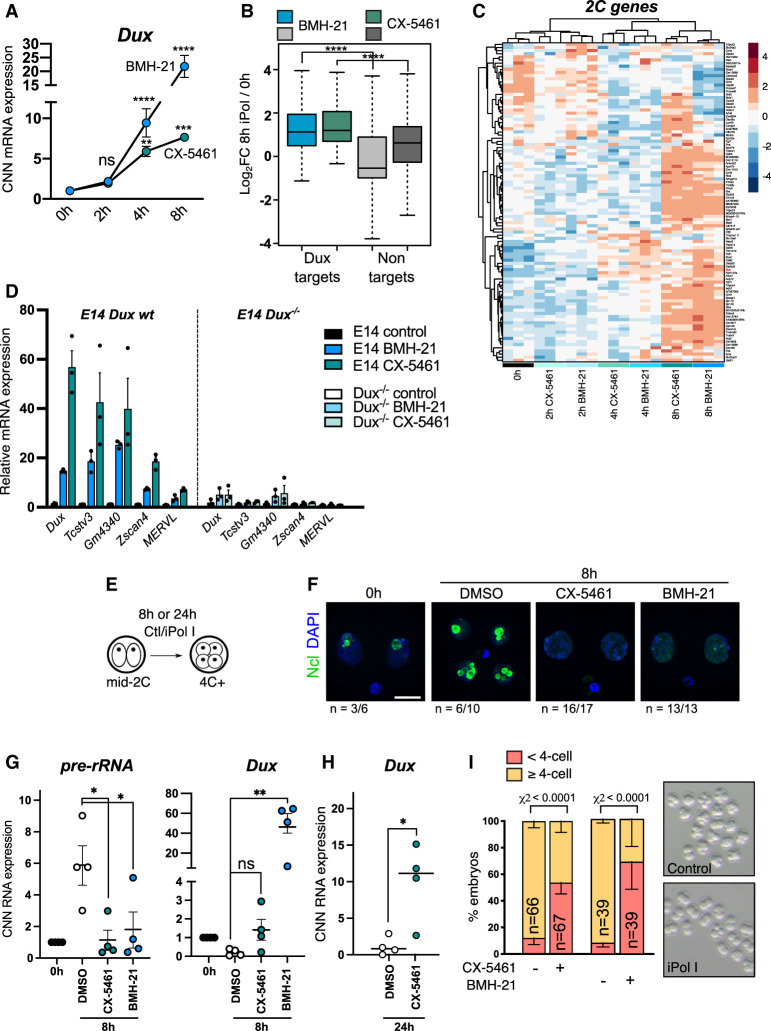
Figure 4.
Nucleolar disruption causes Dux reactivation in ESCs and embryos. (A) Cell number-normalized (CNN) qRT-PCR time-course analysis of Dux up-regulation following iPol I. Data were analyzed as CNN to exclude potential global effects of iPol I on transcription; however, the same results are seen with Rpl7/H2A normalization. Data are mean ± SEM. n = 3 biological replicates. P-values, two-way ANOVA and Šídák multiple comparisons test. (B) Box plot of log2 fold change values for n = 99 Dux target genes (Percharde et al. 2018) versus significantly altered nontargets (FDR < 0.05, CX-5461: n = 8057; BMH-21: n = 13,830) following 8-h iPol I. P-values, two-sided Wilcoxon rank sum test. (C) Heat map of 2C-specific genes (Macfarlan et al. 2012) showing gradual up-regulation following iPol I. Samples are grouped by unsupervised hierarchical clustering. (D) Expression of Dux and 2C-specific genes in wild-type versus Dux−/− E14 ESCs. The control for each cell line is set to 1. Data are mean ± SEM of three biological replicates, representative of two experiments. (E) Schematic for embryo iPol I inhibitor experiments with 1 µM BMH-21 or CX-5461. (F) Ncl immunofluorescence in mid-2C embryos fixed immediately or cultured for 8 h with the indicated inhibitors. (n) Number of embryos with the representative staining from two experiments. Scale bar, 20 µm. (G) CNN qRT-PCR expression data following 8-h iPol I in mid two-cell embryos showing inhibited Dux repression. Data are mean ± SEM. n = 4 experiments with equal numbers of embryos, with levels at 0 h set to 1 in each experiment. P-values, one-way ANOVA with Dunnett multiple comparisons correction. (H) CNN qRT-PCR expression data showing Dux up-regulation after 24 h for 1 µM CX-5461. Data are mean ± SEM. n = 4 experiments. P-values, Welch's two-tailed t-test. (I) Embryo progression rates following 24-h iPol I treatment in n = 4 experiments (CX-5461) and n = 2 experiments (BMH-21). P-values, χ2 test. n = number of embryos.

