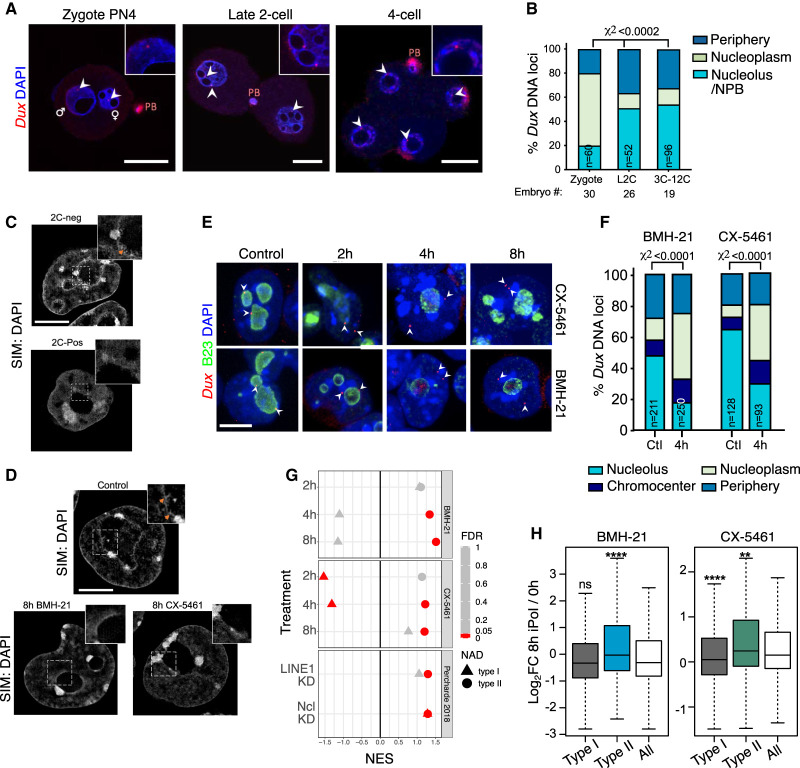
Figure 5.
Nucleolar disruption induces Dux relocalization and activation. (A,B) Representative confocal images and scoring of Dux localization in the indicated embryo stages. (n) Number of pronuclei or nuclei; embryos from two independent experiments were scored. P-values, χ2 test. Scale bar, 20 µm. (C,D) Example images of chromatin distribution as marked by DAPI staining in 3D-SIM imaging experiments in 2C-pos versus 2C-neg cells (C) and in ESCs upon 8-h iPol I (D). (D) 2C-neg cells and control but not iPol I ESCs have nucleolar chromatin fibers, visible as a roughened nucleolar border (orange arrows, inset). Scale bar, 5 µm. (E) Representative immuno-DNA FISH images at the indicated time points of iPol I for Dux alleles (red) compared with nucleolar (B23, green) or nuclear lamina (LaminB; not shown) compartments. Scale bar, 10 µm. (F) Quantification of Dux localization at 4-h iPol I showing movement away from the nucleolus. P-values, χ2 test. (n) Number of nuclei scored. (G) Dot plot of GSEA enrichment scores (NES) and significance (FDR) for type I or type II NADs using expression data following iPol I or following LINE1/Ncl KD (Percharde et al. 2018). (H) Box plot of log2 fold change values for type I NADs (n = 1565) or type II NADs (n = 371) versus all genes at 8-h iPol I. P-values, two-sided Wilcoxon rank-sum test, comparing type I/II NADs with all genes.

