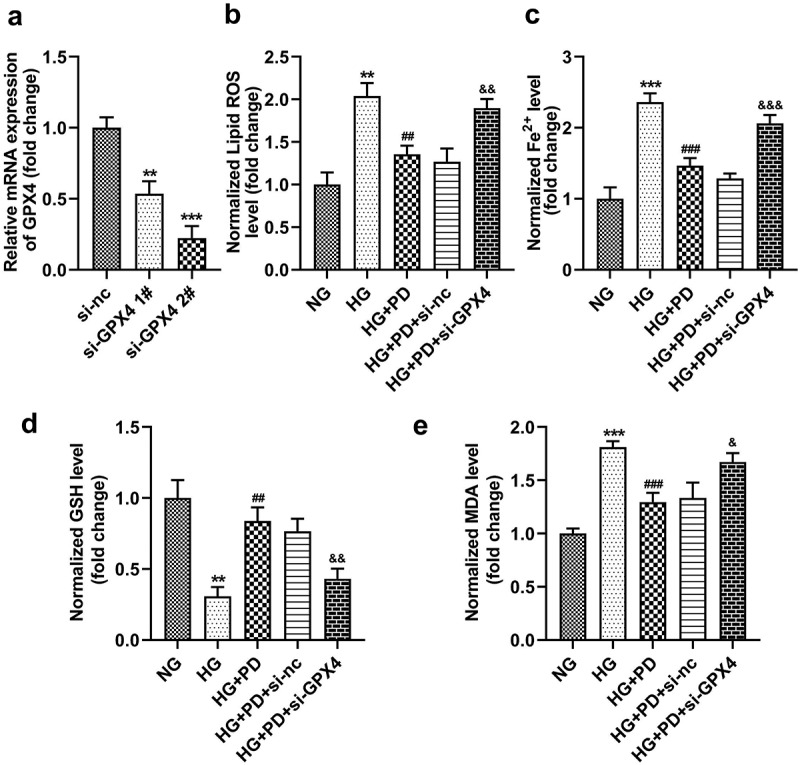
Figure 6.

GPX4 knockdown promoted HG-induced ferroptosis. (a) GPX4 was measured after transfection. (b) Lipid ROS production. (c) Iron levels. (d) GSH levels. (e) MDA levels. **P < 0.01 and ***P < 0.001 vs. si-nc or NG group. ##P < 0.01 and ###P < 0.001 vs. HG group. &P < 0.05, &&P < 0.01, and &&&P < 0.001 vs. HG + PD + si-nc group.
