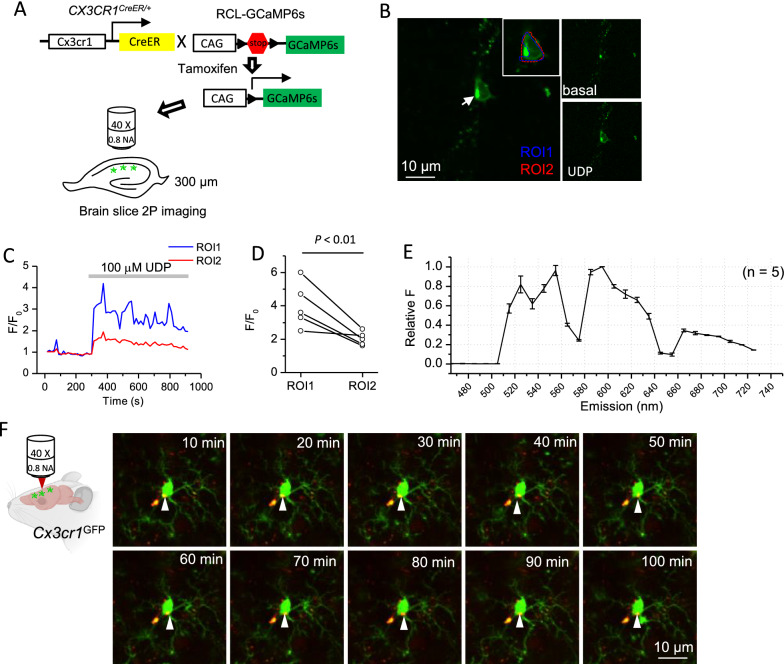
Fig. 5.
Imaging of autofluorescent granules in microglia on live slices and in vivo. A Diagram illustrates the strategy to image calcium signals in hippocampus CA1 microglia cells on live brain slices; B A representative Z-projected image of 60 GCaMP6s frames during 15 min imaging of a microglia cell on Cx3cr1CreER: GCaMP6s mouse brain slice. The arrow points to the soma of a microglia cell, which contains an autofluorescent granule. ROI1 circles the soma of microglia, excluding the autofluorescent granule, while ROI2 including it. Right top: the GCaMP6s image in basal condition. Right bottom: GCaMP6s image during application of 100 µM UDP. C F/F0 in ROI1 and ROI2 during 15 min imaging, at 5 min of which 100 µM UDP was applied. D The peak of F/F0 of GCaMP6s signals during UDP application in ROIs either excluding (ROI1) or including (ROI2) the autofluorescent granules (n = 5 cells from 3 mice, paired t-test). E Emission spectrum of the autofluorescent puncta as in panel (B) by spectral imaging (n = 5 cells from 3 mice). F Representative images of a microglia from Cx3cr1GFP mice with GFP and autofluorescence simultaneously imaged by 2-photon microscopy through cranial window. The white arrows point to the autofluorescent granule in different time points. Bars represent means ± SD

