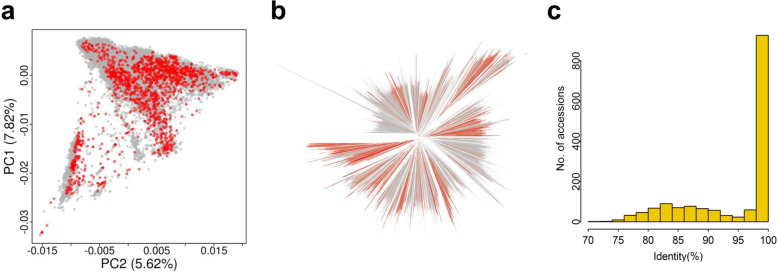
Fig. 4.
Representation of the 1556 accessions in the US 20 K Soybean Collection. a Distribution of the whole-genome sequenced 1556 (1.5 K) accessions and the 20,087 (20 K) accessions using principal component analysis. Red dots denote the 1.5 K accessions and gray dots denote the 20 K accessions. b A neighbor-joining phylogenetic tree constructed by the 1.5 K accessions and 20 K accessions. Branches in orange denote the 1.5 K whole genomes sequenced accessions and those in gray denote the 20 K accessions. c The genomic similarity between the 1.5 K accessions corresponding to the 20 K accessions as determined by comparing the identity of coordinated-matched SNP sites

