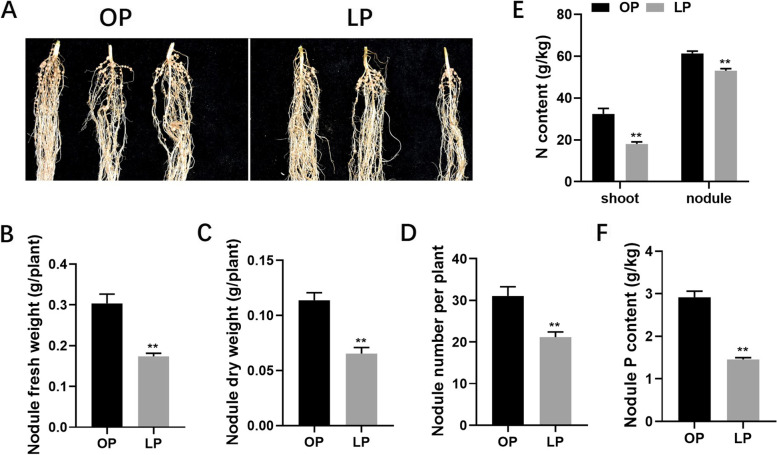
Fig. 1.
Analysis of soybean nodulation under P-sufficient and P-deficient conditions. A Photographs of soybean nodules. B Nodule fresh weight. C Nodule dry weight. D Nodule number. E N content of shoot and nodules. F P content of nodules. Soybean plants and nodules were harvested at 28 dpi in different P conditions (P-sufficient: OP, 500 μM KH2PO4 and P-deficient: LP, 5 μM KH2PO4). Data were presented as the average of three different biological replicates and 20 plants for each replicate. Bars showed the means ± SE values. Asterisks indicate significant difference within a P level in t tests. * p < 0.05, ** p < 0.01

