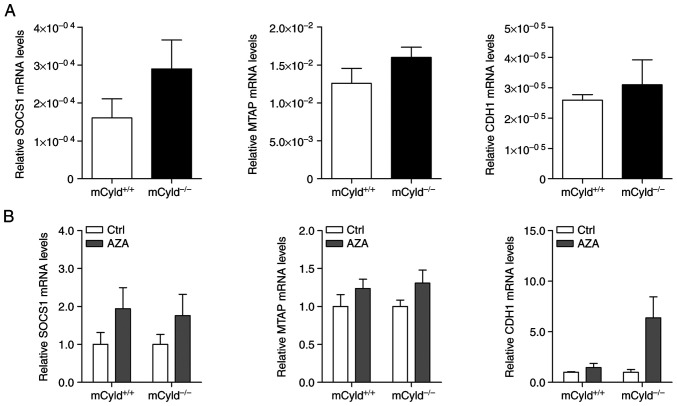
Figure 3.
CYLD and DNA methylation. Quantitative PCR analysis of known hypermethylated genes (SOCS1, MTAP and CDH1) in mCyld+/+ and mCyld−/− cell lines (A) before and (B) after treatment with AZA for 72 h (normalized to untreated Ctrl). CYLD, CYLD lysine 63 deubiquitinase; SOCS1, suppressor of cytokine signaling; MTAP, methylthioadenosine phosphorylase; CDH1, cadherin 1; Ctrl, control; AZA, 5-Aza-deoxycytidine.

