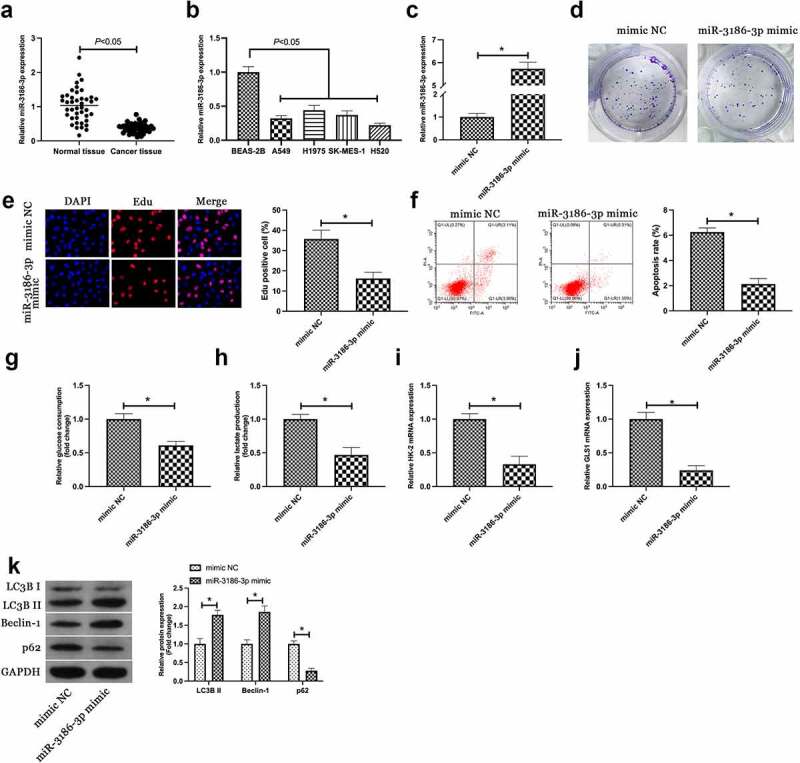
Figure 3.

MiR-3186-3p curbs NSCLC proliferation, glycolysis and autophagy.
(a/b). RT-qPCR to detect miR-3186-3p expression in NSCLC tissue and adjacent normal tissue, BEAS-2B and NSCLC cell lines; (c). MiR-3186-3p detected via RT-qPCR; (d). Colony formation assay to detect cell proliferation; (e). Edu assay to detect DNA replication; F. The apoptosis rate determined via flow cytometry; (g, h). Glucose consumption and lactic acid production; I, J. RT-qPCR to detect HK-2 and GLS1 mRNA expression; K. Western blot to detect LCB3, Beclin-1 and p62 protein expression. C-K, in H520 cells introduced with miR-3186-3p mimic. Manifestation of the data was as mean ± SD (n = 3); *P < 0.05.
