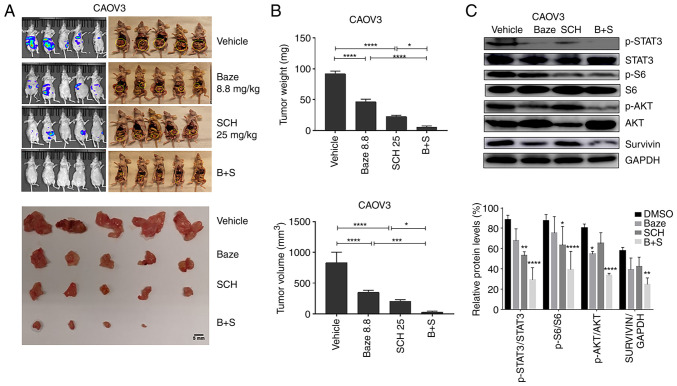
Figure 6.
Baze and SCH suppress ovarian tumor growth. (A) Images of CAOV3 ovarian tumors. Scale bar, 5 mm. (B) Tumor weight and volume in different experimental groups. *P<0.05, ***P<0.001 and ****P<0.0001. (C) Western blot analysis of the levels of IL-6 and IL-8 downstream targets in representative tumors (n=12). *P<0.05, **P<0.01 and ****P<0.0001 (DMSO vs. Baze, SCH or Baze + SCH). B+S, Baze + SCH; Baze, Baze; p-, phosphorylated; Sch, SCH; Baze 8.8, Baze 8.8 mg/kg; SCH25, SCH 25 mg/kg.

