Figure 4.

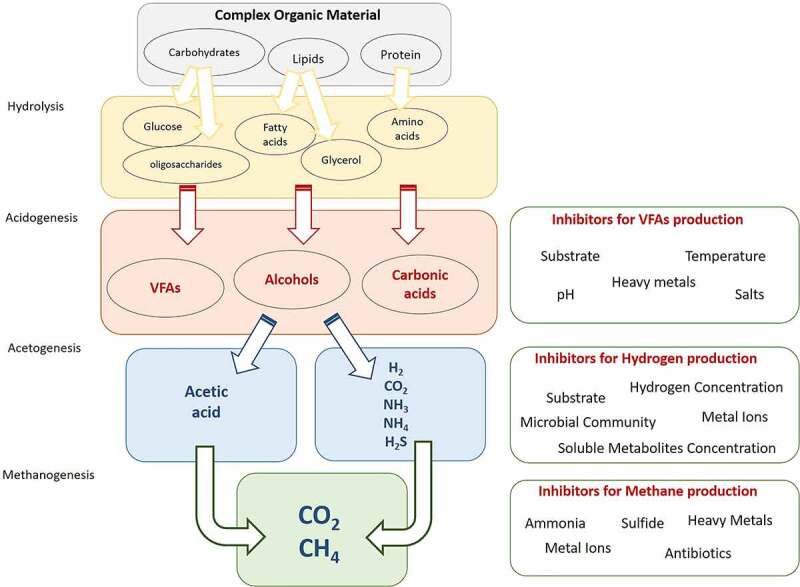
Hydrogen formation during AD. Red crosses show blocked pathways that lead to more hydrogen production. Inhibitors of each stage were shown in the right boxes.

Hydrogen formation during AD. Red crosses show blocked pathways that lead to more hydrogen production. Inhibitors of each stage were shown in the right boxes.