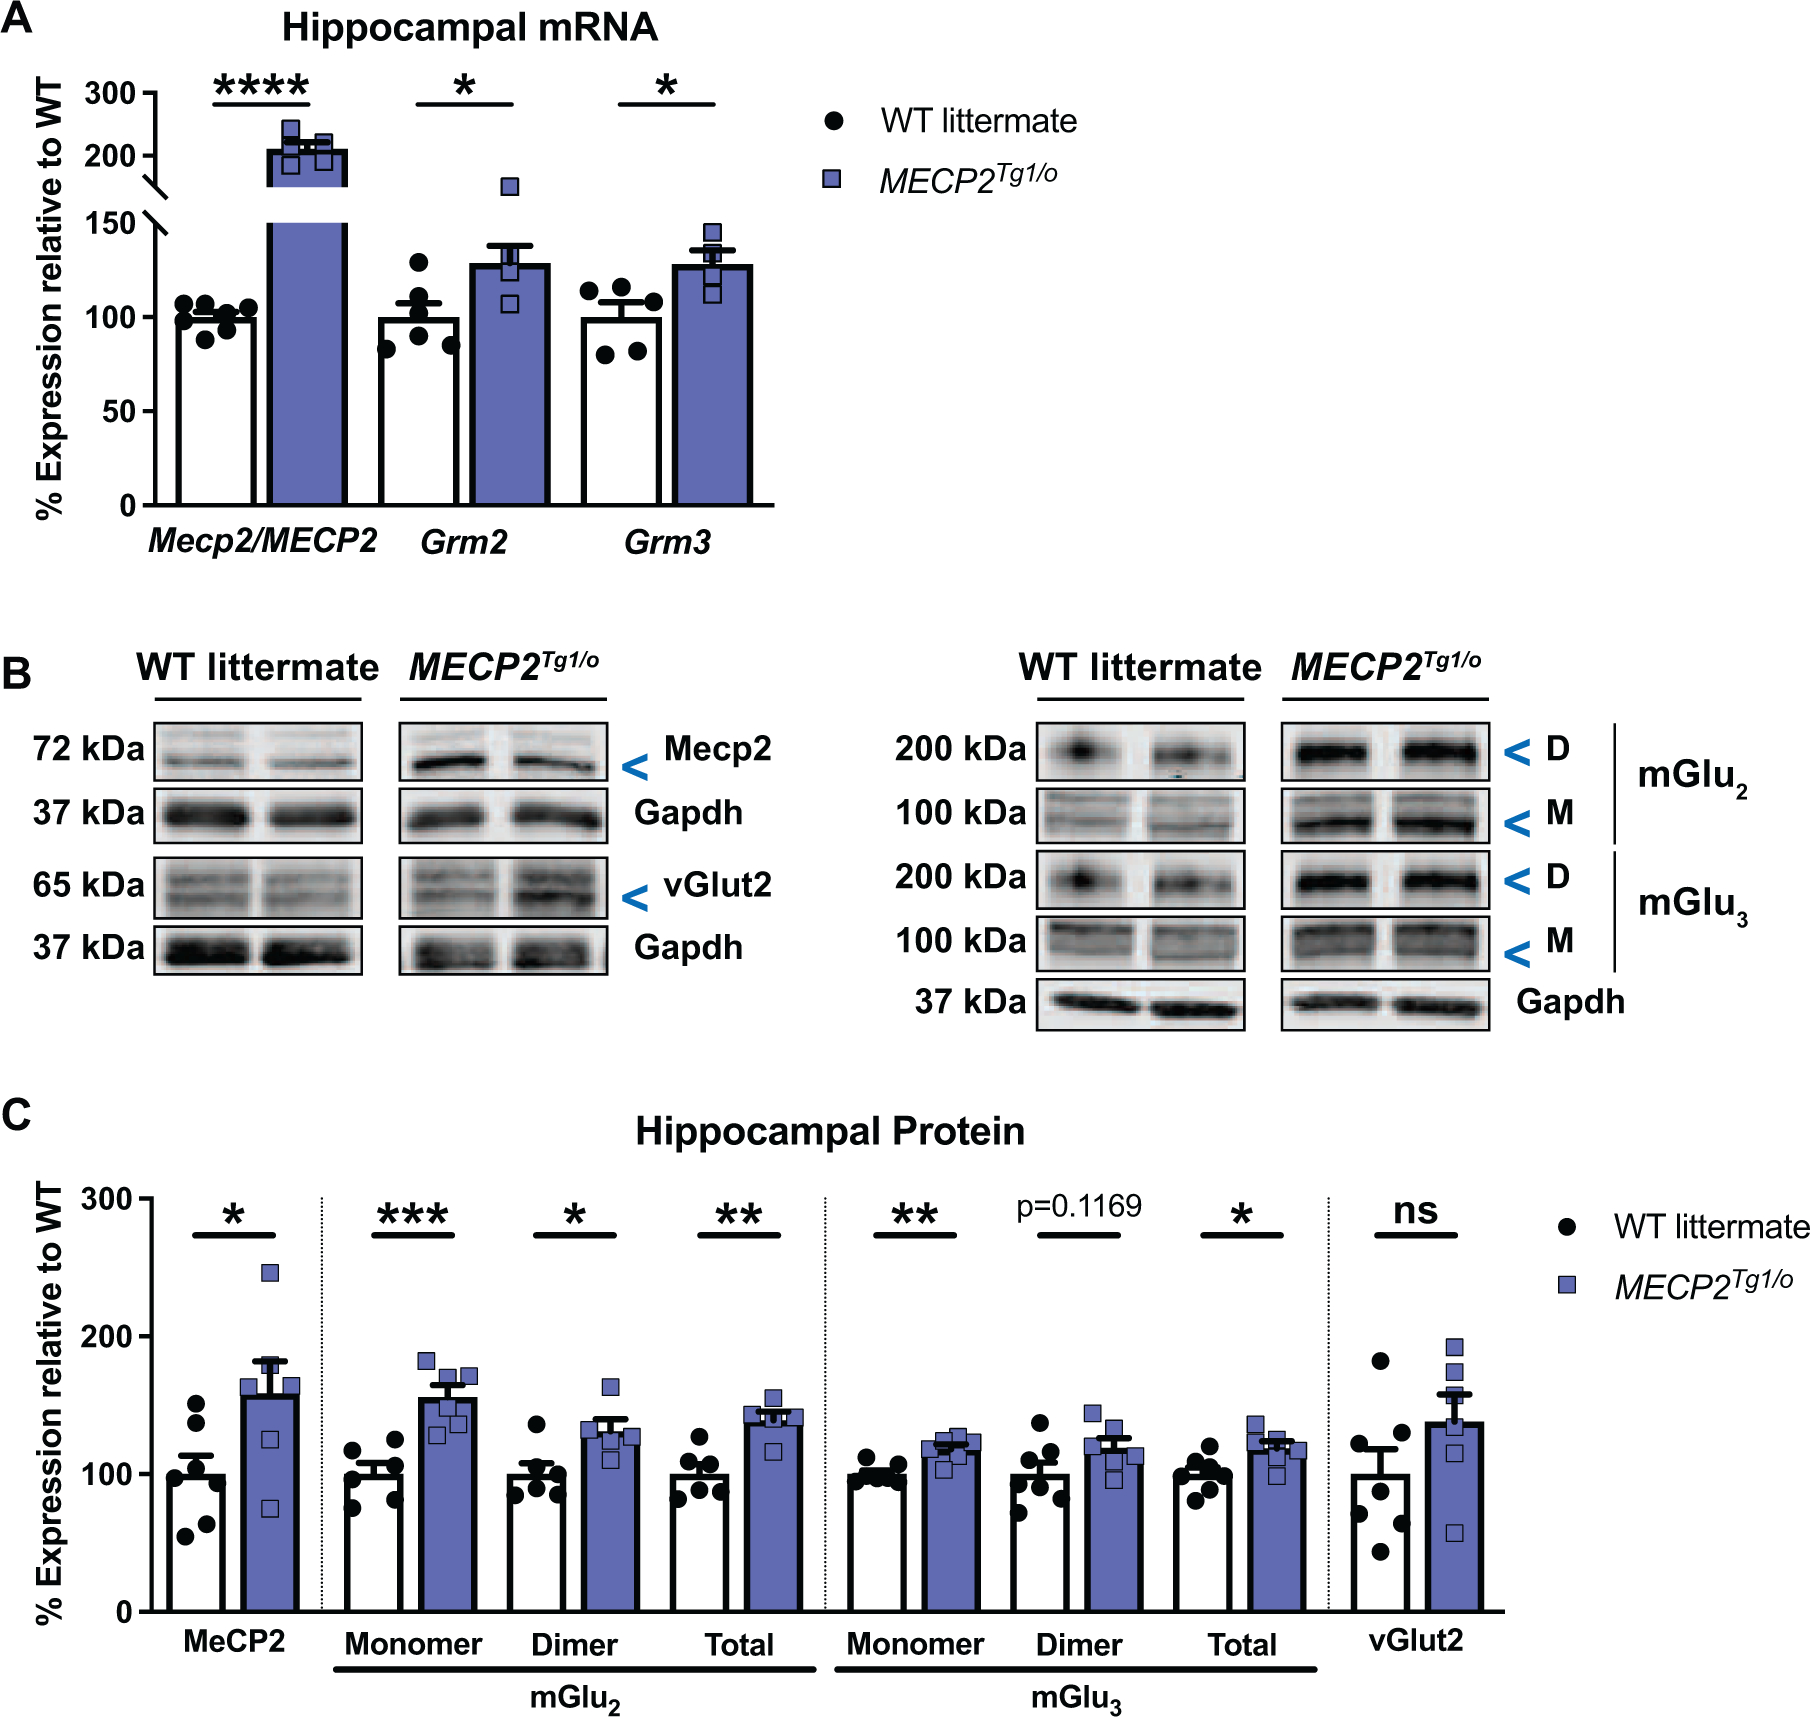
Figure 2: Hippocampal mGlu2 and mGlu3 expression is increased in MDS mice.

(A) Compared to WT littermates (white bars / black circles, n=5–7), Mecp2/MECP2, Grm2 and Grm3 transcripts are increased in the hippocampus of 8–9-week-old MECP2Tg1/o mice (blue bars / squares, n=4–5) (Mecp2/MECP2: t(10)=11.89, p<0.0001; Grm2: t(8)=2.476, p=0.0384; Grm3: t(7)=2.586, p=0.0362). (B) Representative immunoblots illustrating MeCP2 (72 kDa), mGlu2 or mGlu3 dimer (“D”, 200 kDa) and monomer (“M”, 100 kDa), vGlut2 (65 kDa), and Gapdh (37 kDa) loading control in hippocampal samples of WT littermates and MECP2Tg1/o mice. (C) Protein expression of MeCP2, mGlu2, and mGlu3 (total = monomer + dimer) is increased in MECP2Tg1/o mice (n=5–6) relative to WT littermates (n=6–7) (MeCP2: t(11)=2.269, p=0.0444; mGlu2: Monomer: t(10)=4.669, p=0.0009; Dimer: t(9)=2.642, p=0.0268; Total: t(9)=4.028, p=0.0030; mGlu3: Monomer: t(11)=4.140, p=0.0016; Dimer: t(11)=1.701, p=0.1169; Total: t(11)=2.597, p=0.0248). vGlut2 is unchanged between genotypes (t(11)=1.433, p=0.1797). Student’s t-test. ns (not significant), *p<0.05, **p<0.01, ***p<0.001, ****p<0.0001.
