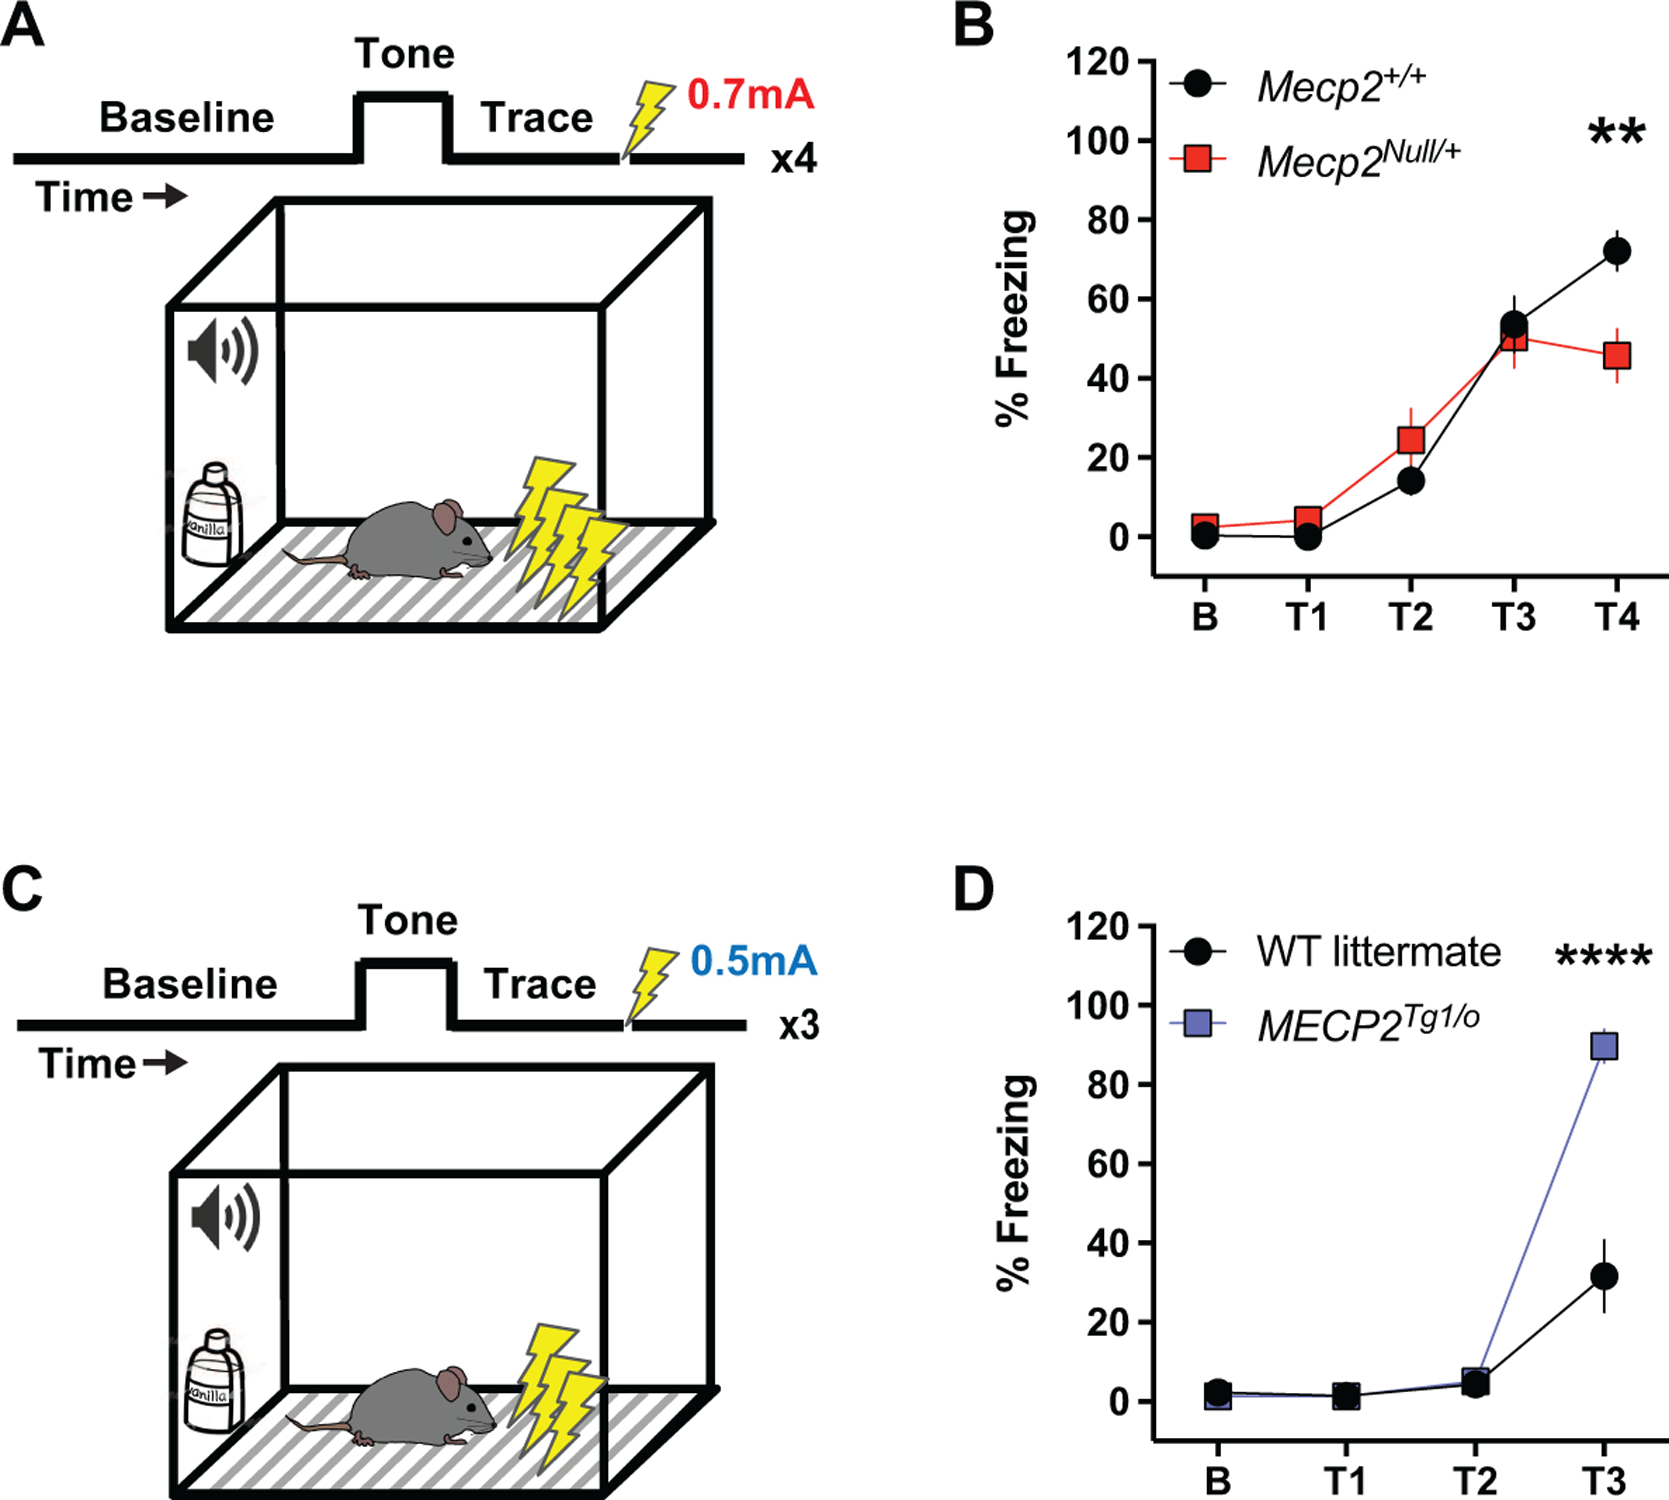
Figure 3: Contrasting phenotypes in trace fear conditioning between Mecp2Null/+ and MECP2Tg1/o animals.

(A) Diagram illustrating the trace fear conditioning paradigm. Mice are trained to associate their environment (context and tone) with an aversive stimulus in the form of a mild foot shock (0.7 mA), with a temporal component (trace) separating the tone and shock. Four tone-trace-shock pairings are presented and percent freezing during the trace period is measured as a proxy for fear learning behavior. (B) Compared to littermate controls, Mecp2+/+ (black circles, n=17), 20–25-week-old Mecp2Null/+ animals (red squares, n=12) display attenuated percent freezing during the fourth trace period (T4) (F(4,108)=4.276; p=0.0016). (C) Diagram illustrating the trace fear conditioning paradigm in WT littermates and MECP2Tg1/o animals. The protocol mentioned above in RTT mice is followed with notable differences in the foot shock intensity (0.5 mA) and the number of tone-trace-shock pairings (three). (D) Compared to WT littermates (black circles, n=11), 8–12-week-old MECP2Tg1/o animals (blue squares, n=10) exhibit increased percent freezing during the third trace period (T3) (F(3,57)=35.14; p<0.0001). 2-way ANOVA with Sidak’s post-hoc test. **p<0.01, ****p<0.0001.
