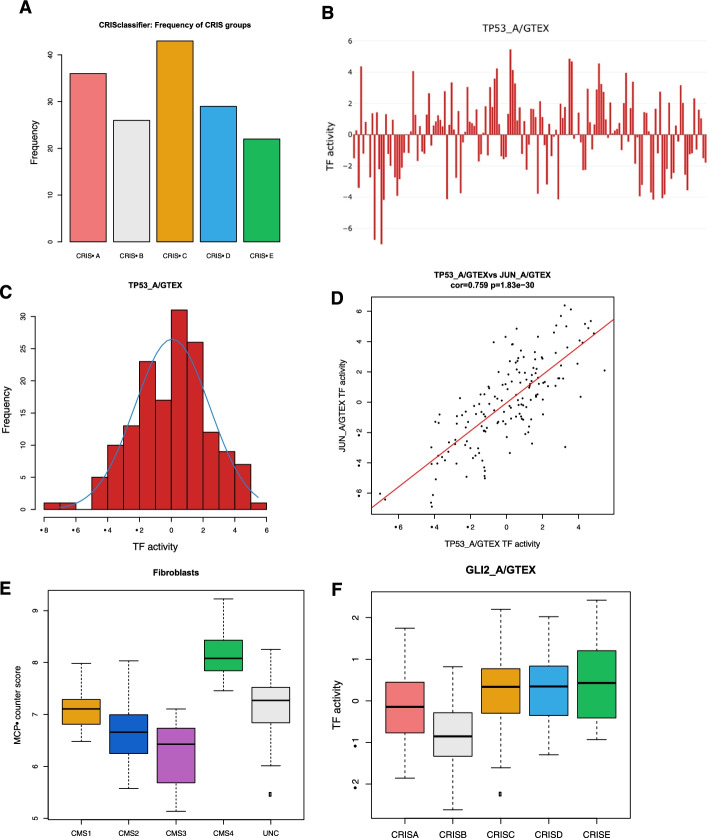
Fig. 2.
Characterisation of Stage II/III CRC (GSE103479) dataset in classifieRc. a Histogram depicting frequency of patients within each CRIS subgroup. b Interactive barplot showing TP53 transcription factor activity across all samples in the dataset. c Histogram showing the distribution of TP53 activity across all samples. d Dot plot visualising the correlation between TP53 and JUN transcription factor activity. e Box and whisker plot showing distribution of the MCP-counter score for Fibroblasts amongst the CMS subgroups. f Box and whisker plot showing distribution of the DoRothEA TF-activity score for GLI2 amongst the CRIS subgroups

