Figure 2.

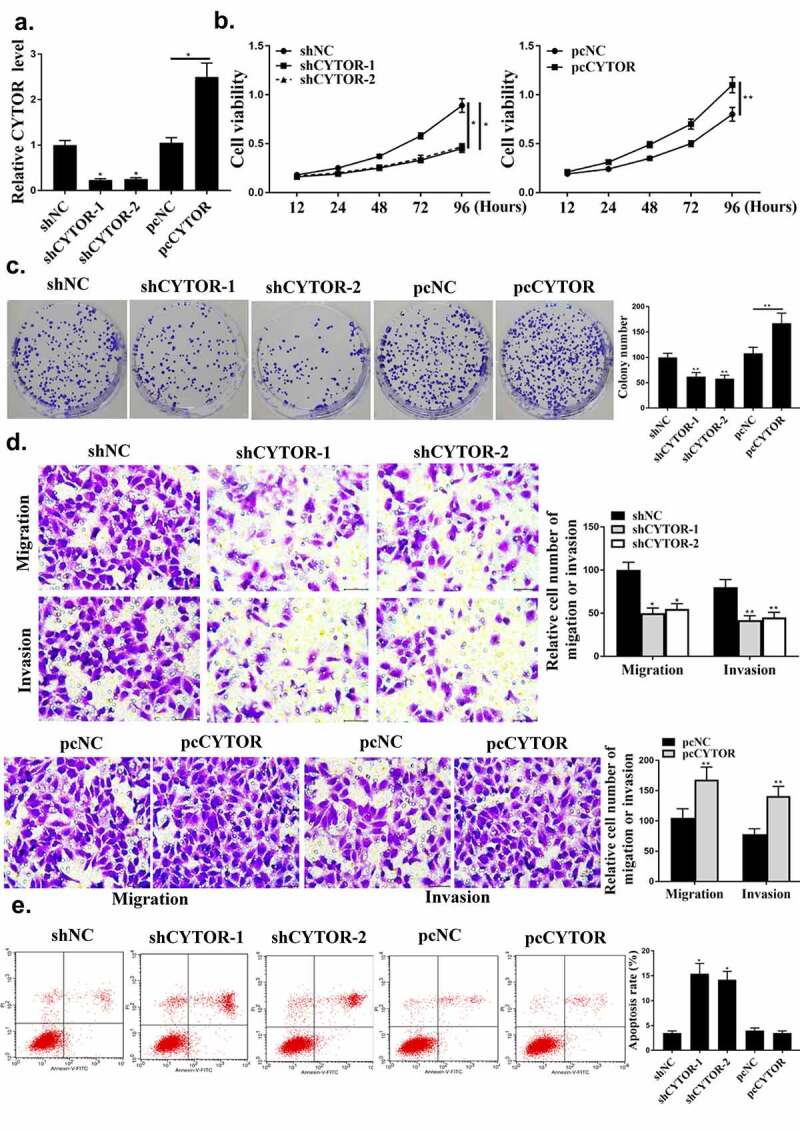
CYTOR regulated HCC progression in vitro. (a) CYTOR expression. (b) Cell viability measured by CCK8. (c) Colony formation. (d) Cell invasion measured by Transwell assay. (e) Flow cytometry. ** p < 0.01, *p < 0.05, n = 3.

CYTOR regulated HCC progression in vitro. (a) CYTOR expression. (b) Cell viability measured by CCK8. (c) Colony formation. (d) Cell invasion measured by Transwell assay. (e) Flow cytometry. ** p < 0.01, *p < 0.05, n = 3.