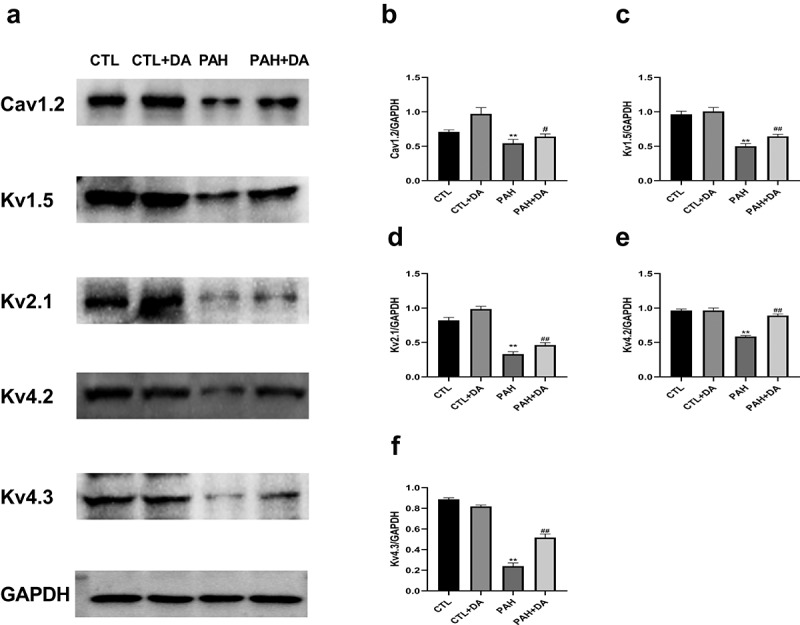
Figure 5.

Effects of Dapagliflozin administration on Ion channel proteins in PAH’s rats. Representative Western blots (a). Quantitative results of the Cav1.2 (b), Kv1.5 (c), Kv2.1 (d), Kv4.2 (e), Kv4.3 (f) (n = 3 per group). Data are presented as mean as ±SEM. *P < 0.05 vs. CTL group, #P < 0.05 vs. PAH group. **P < 0.01 vs. CTL group, ##P < 0.01 vs. PAH group.
