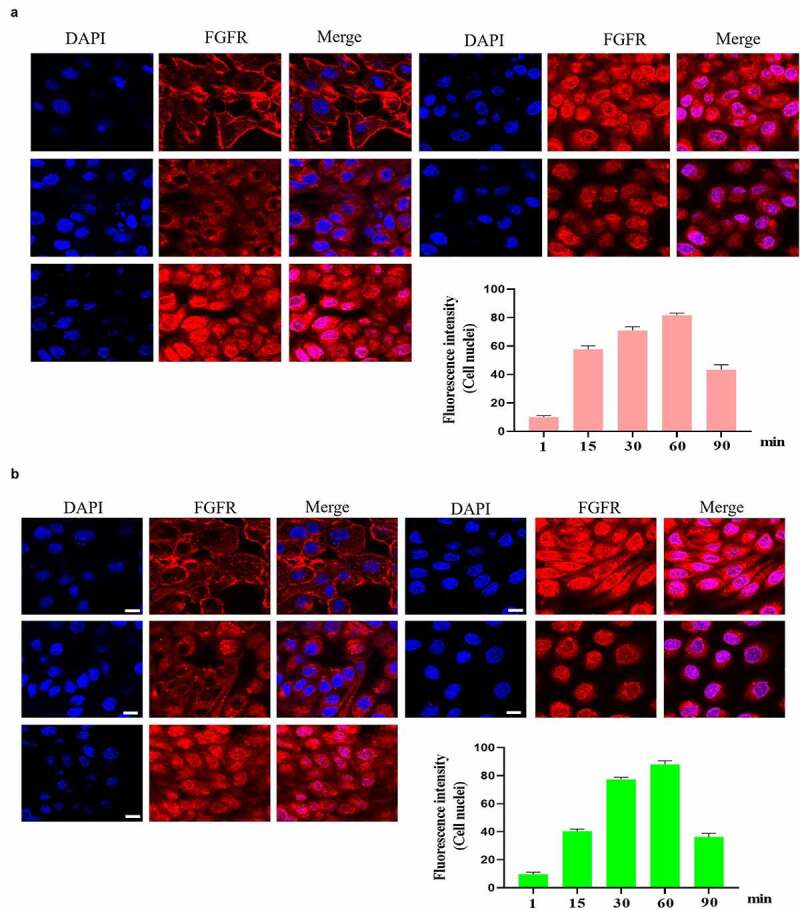
Figure 3.

(a-b). FGFR’s intracellular trafficking under FGF stimulation. The GES-1 and RGM-1 cells were seeded on 6-well cell culture plates. 40% confluent cells were starved for 10 h. The cells were then stimulated with FGF for the indicated time points. After the cells were fixed, the cells were stained with anti-FGFR. The cell samples were then observed using CLSM. The average fluorescence intensity of 50 cells was measured and analyzed. Asterisks indicate significant differences (P < 0.05).
