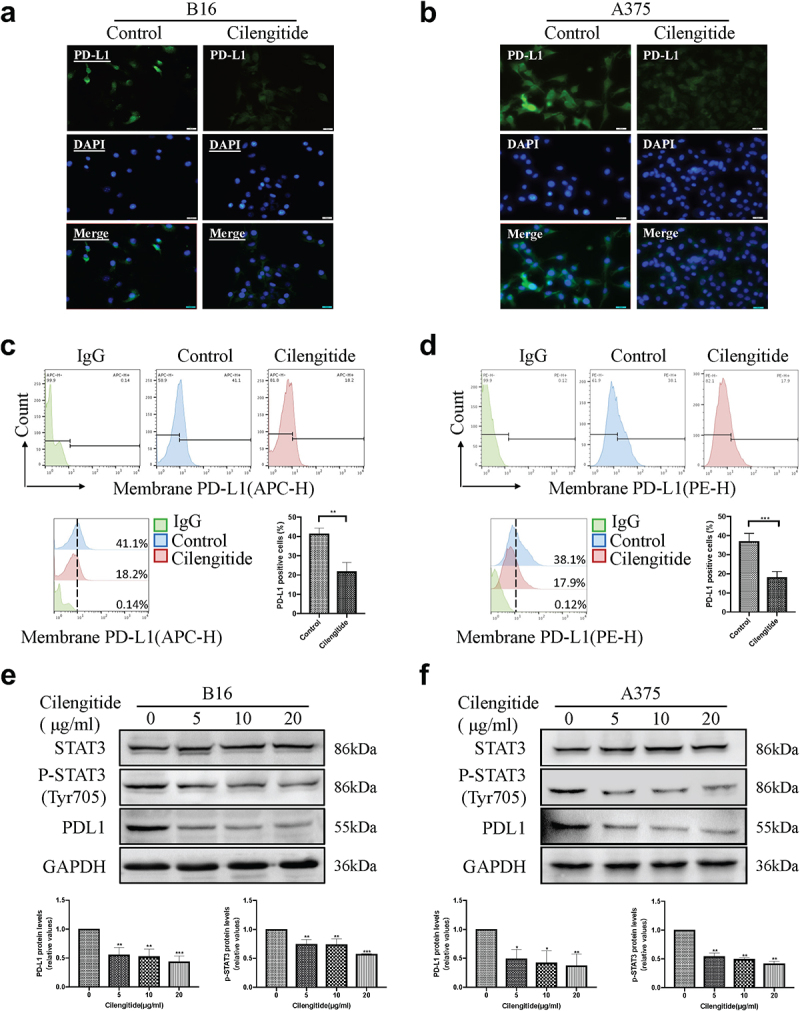
Figure 3.

Cilengitide decreases the expression of PD-L1 in B16 and A375 cells. (a and b) Fluorescence microscopic images showing the expression of PD-L1 in B16 and A375 cells treated with or without 5 µg/ml cilengitide for 12 hours. Scale bar: 50 µm. (c and d) The proportion of PD-L1 positive B16 and A375 cells detected by flow cytometry after treatment with 5 µg/ml cilengitide for 12 hours. (e and f) The expressions of STAT3, p-STAT3, and PD-L1 detected by Western blotting in B16 and A375 cells after treatment with 0, 5, 10, and 20 µg/ml cilengitide for 12 hours. Data were represented as mean ± standard deviation. *p < 0.05, **p < 0.01, ***p < 0.001, NS, not significance (Student’s t test). Each experiment was repeated three times.
