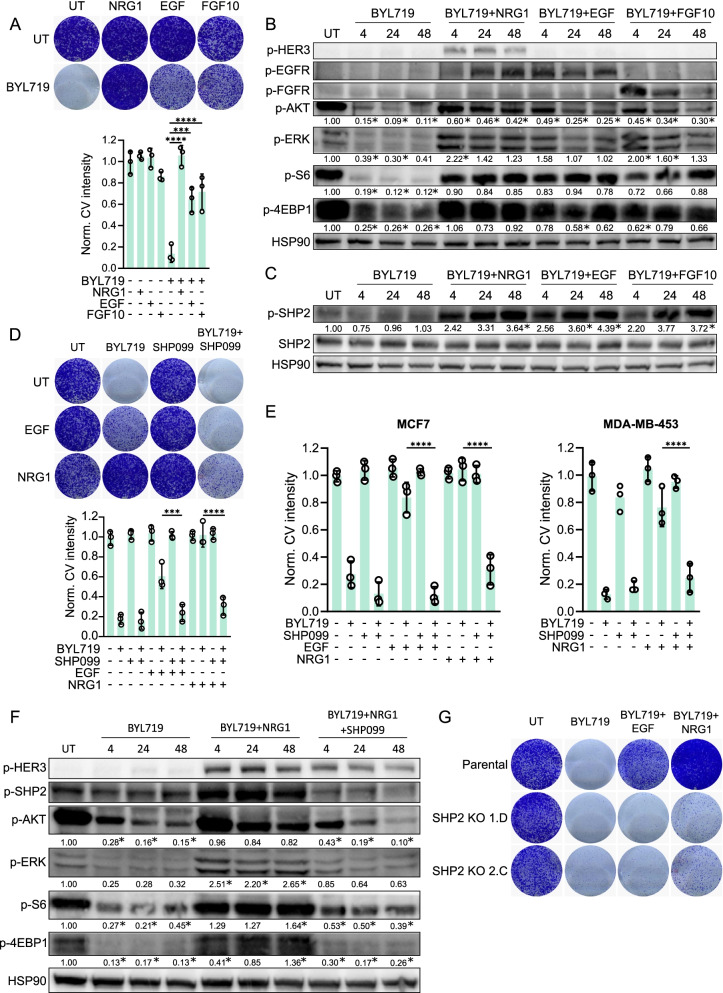
Fig. 1.
Inhibition of SHP2 counteracts acquired resistance to PI3K inhibition in PI3K mutant breast cancer cells. a Multiple growth factors confer resistance to BYL719 in PI3K mutant T47D breast cancer cells. Top: colony formation. Bottom: quantification of crystal violet staining intensity of three independent colony formation experiments. Significance between indicated conditions was calculated by one-way ANOVA. ***p ≤ 0.001, ****p ≤ 0.0001. pBYL719: 2 μM. NRG1, EGF and FGF10: 50 ng/ml. UT: vehicle-treated. b Western blot showing the biochemical effects on PI3K and MAPK signaling after BYL719, NRG1, EGF or FGF10 treatments in T47D cells for 4, 24 or 48 h. BYL719: 2 μM. NRG1, EGF and FGF10: 50 ng/ml. Relative gel band intensities of phosphorylated proteins are indicated below each row. Significant differences (p ≤ 0.05) in signaling in comparison to the untreated condition are marked with an *. c Western blot showing SHP2 phosphorylation of Y542 upon NRG1, EGF and FGF10 treatment in T47D cells. BYL719: 2 μM. NRG1, EGF and FGF10: 50 ng/ml. Significant differences (p ≤ 0.05) in induction of SHP2 phosphorylation in comparison to the untreated condition are marked with an *. d SHP099 reverses growth factor-induced BYL719 resistance in T47D. Top: colony formation. Bottom: quantification of crystal violet staining intensity of three colony formation experiments. Significance between indicated conditions was calculated by one-way ANOVA. ***p ≤ 0.001, ****p ≤ 0.0001. BYL719: 2 μM. EGF and NRG1: 50 ng/ml. SHP099: 5 μM. e SHP099 reverses growth factor-induced BYL719 resistance in MCF7 and MDA-MB-453 cells. Quantifications of crystal violet staining intensity of three colony formation experiments are shown. Significance between indicated conditions was calculated by one-way ANOVA. ****p ≤ 0.0001. BYL719: 5 μM (MCF7) and 1 μM (MDA-MB-453). EGF and NRG1: 50 ng/ml. SHP099: 5 μM. f Western blot showing the biochemical effects on PI3K and MAPK signaling after BYL719, NRG1 and SHP099 treatment in T47D cells. BYL719: 2 μM. NRG1: 50 ng/ml. SHP099: 5 μM. Significant differences (p ≤ 0.05) in signaling in comparison to the untreated condition are marked with an *. g Colony formations with two independent T47D SHP2 knockout clones treated with BYL719 (2 μM), NRG1 and EGF (both 50 ng/ml)

