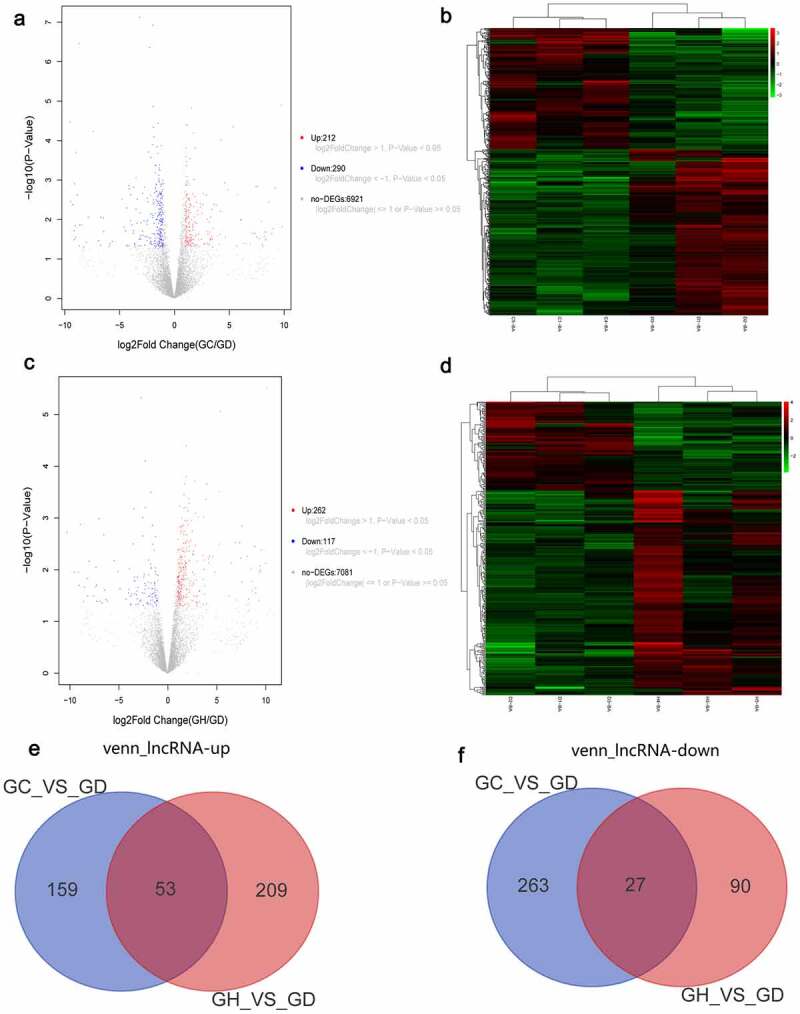
Figure 2.

Volcano map, heatmap and Venn diagram analysis of DElncRNAs in the GC/GD and GH/GD groups.
A: Volcano map of DElncRNAs in the GC/GD group; B: Heatmap of DElncRNAs in the GC/GD group; C: Volcano map of DElncRNAs in the GH/GD group; D: Heatmap of DElncRNAs in the GH/GD group; E: Venn diagram of up-regulated DElncRNAs; F: Venn diagram of down-regulated DElncRNAs. In the volcano map, horizontal axis was the value of Log2 logarithmic conversion, and the vertical axis is p-value after logarithmic conversion of -Log10. Heatmap shows result of a two-way hierarchical clustering of DElncRNAs (row) and samples (column). DElncRNAs clustering tree is shown on the left. Red and green represent up-regulated and down-regulated DElncRNAs, respectively. GD, GC, and GH represent the normal control group, the myocardial fibrosis group and the heart failure group, respectively.
