
Figure 4.
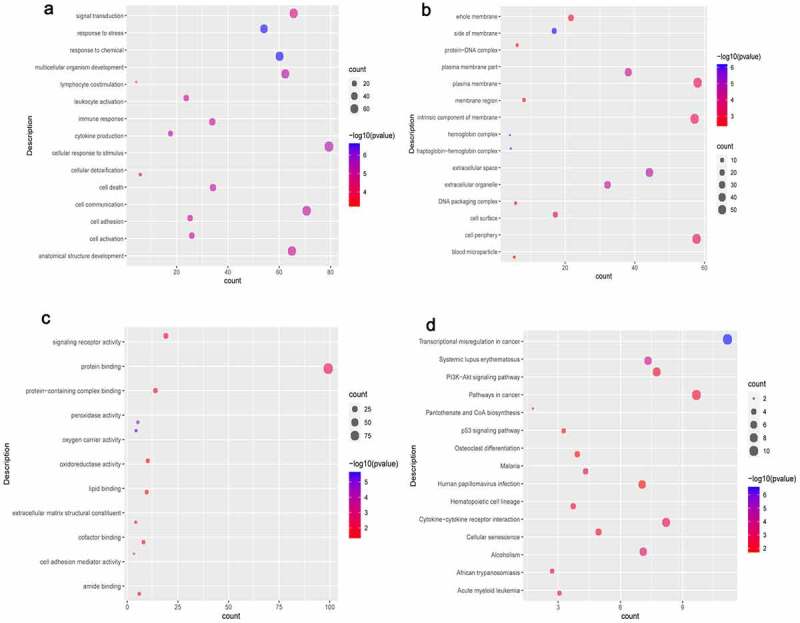
Significantlly enriched GO terms and KEGG pathways of common DEmRNAs.
A: Biological process (BP); B: Cell composition (CC); C: Molecular function (MF); D: Kyoto Encyclopedia of Genes and Genomes (KEGG) pathways. The x-axis shows counts of DEmRNAs enriched in GO terms or KEGG pathways, and the y-axis shows GO terms or KEGG pathways. Red represents up-regulated DEmRNAs and blue represents down-regulated DEmRNAs.