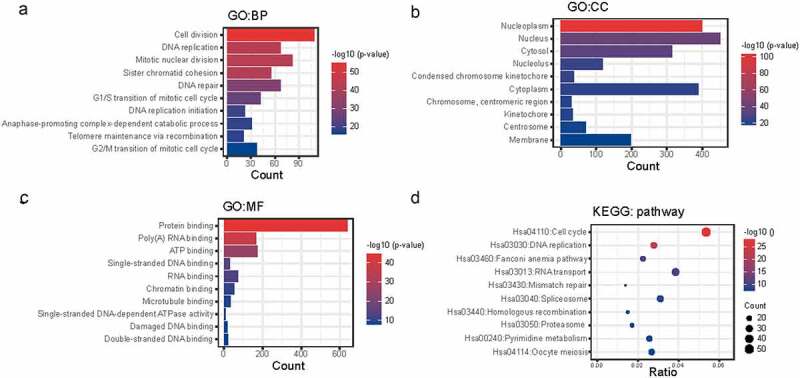
Figure 4.

Enrichment analysis of NCAPG co-expressed genes. (a-d) the positively co-expressed genes of NCAPG (r ≥ 0.4, p < 0.01) gained through web tool cBioPortal were subjected to GO (a-c) and KEGG analysis (d). BP: Biological Process; CC: Cellular Component; MF: Molecular Function.
