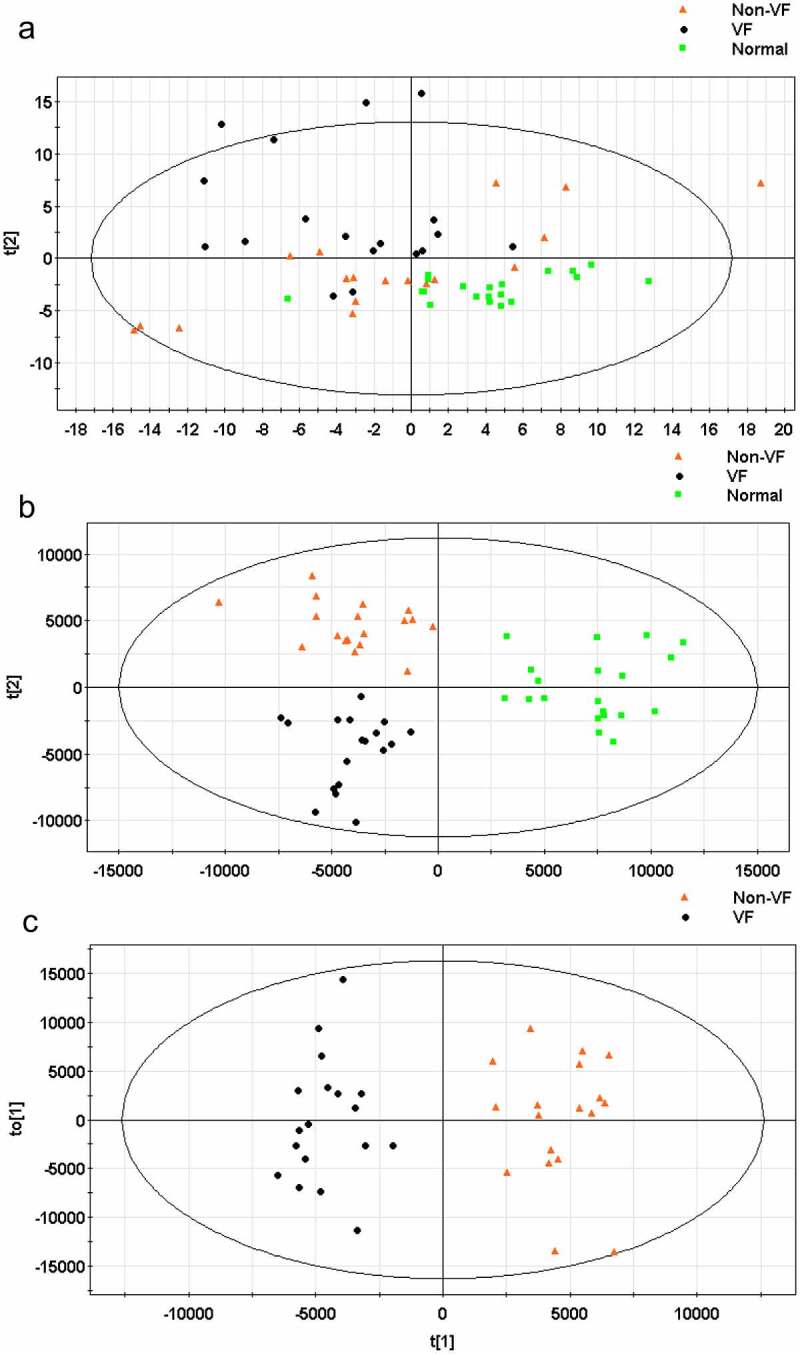
Figure 3.

(a) The score plot for the first two principal components was shown. (b) OPLS-DA score plot with two predictive principal components and six orthogonal principal components was built (R2X = 71.1%, R2Y = 79.9%, Q2 = 46%) for all participants (VF, non-VF and healthy control (normal). (c) OPLS-DA score plot of the VF (VF) and non-VF (non-VF) group. One predictive principal component and four orthogonal principal components (R2X = 51%, R2Y = 92.4%, Q2 = 60.3%). Notes: All figures were developed from SIMCA-P 12.0 and every point represents a sample. R2 scores suggest performance of a model, and Q2 scores is an assessment of reproducibility, based on cross-validation.
